RTX Corp Reports Robust Q2 2026 Results and Raises Full-Year Outlook
Key Highlights
- Q2 2026 Sales: \$24.7 billion, up 14% year-over-year and 16% organically.
- Adjusted Earnings Per Share (EPS): \$1.89, up 21% from the prior year.
- Free Cash Flow: \$2.9 billion for the quarter.
- Backlog: \$289 billion, a 22% increase year-over-year, comprised of \$170 billion commercial and \$119 billion defense.
- Full-Year Guidance Raised: Adjusted sales guidance increased to \$95.0-\$96.0 billion (from \$92.5-\$93.5 billion), adjusted EPS now \$7.10-\$7.25 (from \$6.70-\$6.90), and free cash flow guidance up to \$8.50-\$8.75 billion (from \$8.25-\$8.75 billion).
- Strategic Divestiture: RTX reached an agreement to sell Raytheon’s Blue Canyon Technologies business for \$20 million.
Segment Performance
Collins Aerospace
- Sales: \$8.21 billion (up 8% reported, 13% organically).
- Operating Profit: \$1.31 billion (up 11%); Adjusted Operating Profit: \$1.37 billion (up 10%).
- Strong growth in commercial OE (+26%), commercial aftermarket (+10%), and defense (+7%).
- Margin expansion: Adjusted operating profit margin rose to 16.7% from 16.4%.
- Restructuring charges associated with cost transformation initiatives affected reported profit.
Pratt & Whitney
- Sales: \$8.89 billion (up 16%).
- Operating Profit: \$738 million (up 50%); Adjusted Operating Profit: \$740 million (up 22%).
- Commercial aftermarket sales surged 25%; military sales up 23%; commercial OE sales down 8% due to engine mix.
- Prior year included \$100 million charge related to a customer bankruptcy.
- Margin expansion: Adjusted operating profit margin up to 8.3% from 8.0%.
Raytheon
- Sales: \$8.27 billion (up 18%).
- Operating Profit: \$1.04 billion (up 29%); Adjusted Operating Profit: \$1.04 billion (up 29%).
- Growth driven by land/air defense systems, naval programs, air/space defense systems (including Patriot, Standard Missile, and AMRAAM).
- Adjusted operating profit margin: 12.6% (up from 11.6%).
Financial Summary
| Metric | Q2 2026 | Q2 2025 | Change |
|---|---|---|---|
| Sales | \$24.71B | \$21.58B | +14% |
| Adjusted Sales | \$24.71B | \$21.58B | +14% |
| Net Income | \$2.14B | \$1.66B | +29% |
| Adjusted Net Income | \$2.58B | \$2.12B | +22% |
| EPS | \$1.57 | \$1.22 | +29% |
| Adjusted EPS | \$1.89 | \$1.56 | +21% |
| Free Cash Flow | \$2.88B | (\$72M) | N/A |
Balance Sheet and Cash Flow
- Cash and cash equivalents at quarter-end: \$8.31 billion (up from \$7.44 billion at year-end 2025).
- Operating cash flow for Q2: \$3.55 billion (up sharply from \$458 million in Q2 2025).
- Capital expenditures: \$669 million in Q2.
- Shareowners’ equity: \$66.4 billion (up from \$65.2 billion at year-end 2025).
- Long-term debt: \$31.9 billion (down from \$34.3 billion).
Updated Guidance and Outlook
- Organic sales growth guidance increased to 8–9% (from 5–6%).
- Adjusted EPS guidance raised to \$7.10–\$7.25 (from \$6.70–\$6.90).
- Free cash flow guidance raised to \$8.50–\$8.75 billion (from \$8.25–\$8.75 billion).
- Management cites robust demand, strong backlog, margin expansion, and new technology introductions as key drivers.
Potential Price-Sensitive Events
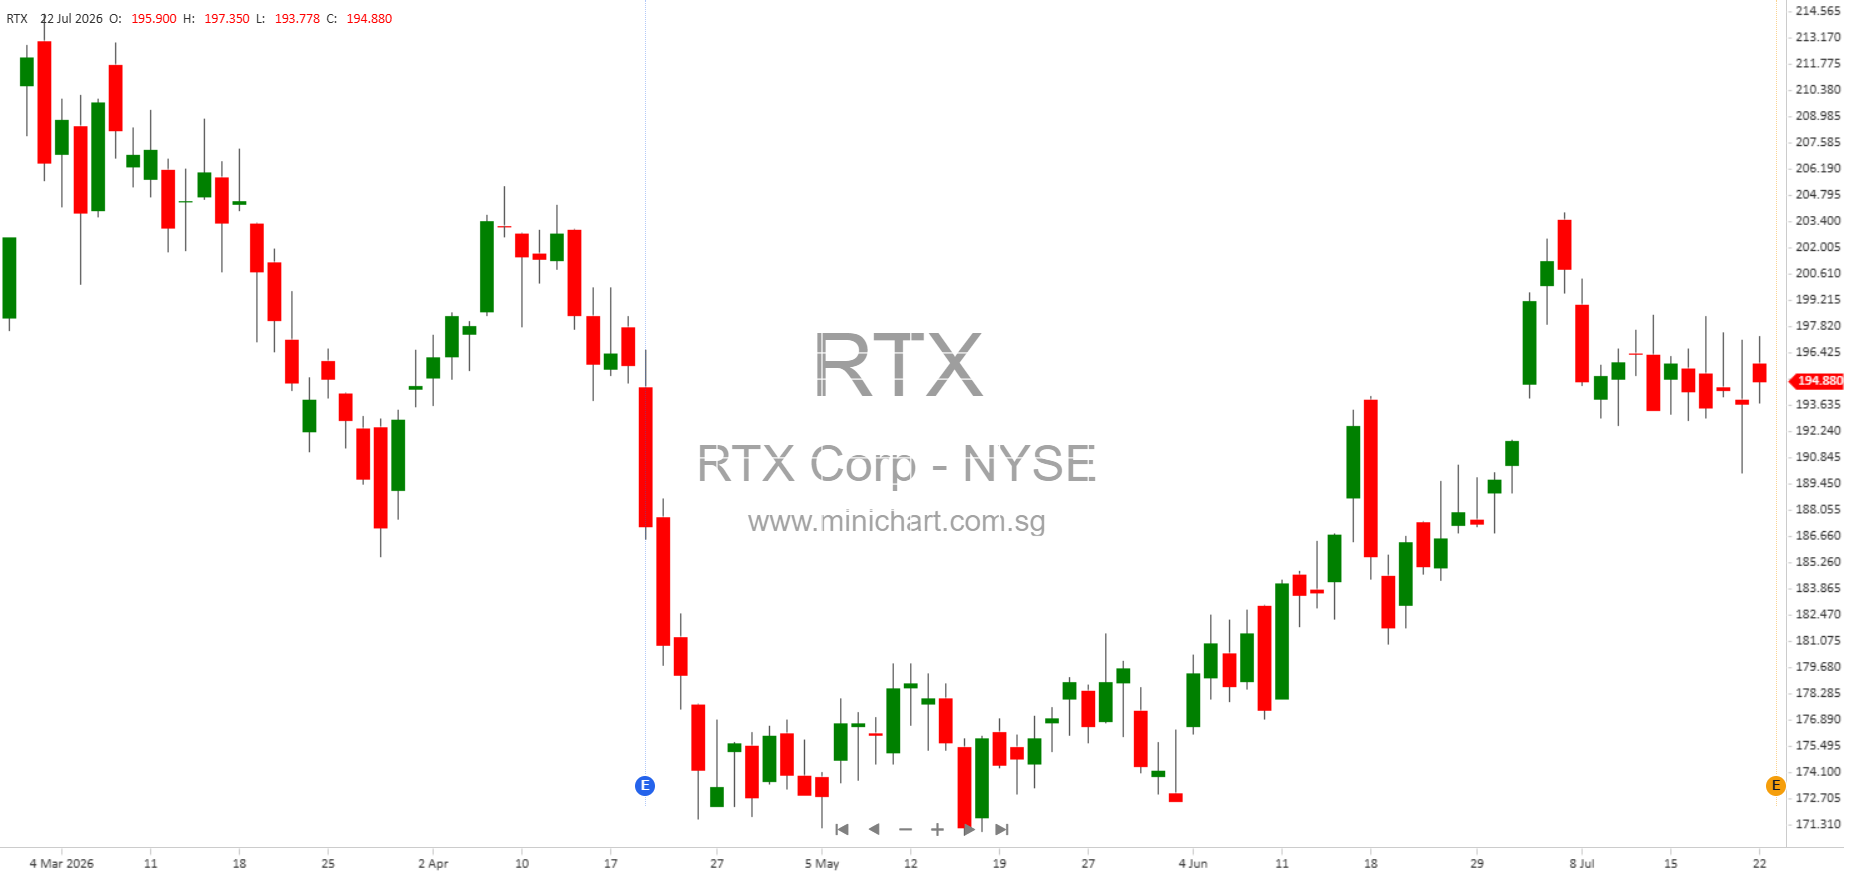
- Guidance Increase: RTX raising its full-year outlook for adjusted sales, EPS, and free cash flow is likely to be positively viewed by investors and could move the share price.
- Strategic Divestiture: Sale of Raytheon’s Blue Canyon Technologies business may signal portfolio optimization and focus on core operations.
- Backlog Growth: The 22% year-over-year increase in backlog, now at \$289 billion, points to sustained future revenue and operational visibility.
- Litigation Matter: A \$69 million charge in Q2 2026 was taken related to a litigation matter. Management deems it non-operational, but investors should monitor for any further legal developments.
- Operational Risks: RTX notes risks including supply chain disruptions, compliance matters, cybersecurity, and issues with Pratt & Whitney powder metal used in engine parts, which could impact future results.
Non-GAAP Measures and Adjustments
- RTX uses several non-GAAP measures including adjusted sales, adjusted EPS, and free cash flow. These exclude restructuring, acquisition-related and other significant non-recurring items.
- Management believes these metrics better reflect ongoing performance, but notes that reconciling to GAAP for future periods is not possible without unreasonable effort due to the unpredictability of certain excluded items.
- Investors should be aware of these adjustments when comparing RTX’s performance to peers.
Risks and Forward-Looking Statements
RTX’s forward-looking guidance is subject to a wide range of risks including changes in economic and political conditions, defense spending, supply chain disruptions, product development challenges, legal proceedings, and emerging issues such as climate change and cybersecurity. The company notes that actual results may differ materially from projections due to these uncertainties.
Conclusion
RTX delivered strong Q2 2026 results with double-digit organic sales growth and significant margin expansion across all segments, prompting an upward revision to its full-year guidance. The robust backlog, successful cost transformation initiatives, and ongoing portfolio optimization (including divestitures) position RTX for continued growth. However, investors should remain aware of operational and legal risks that could impact future financial performance.
Disclaimer: This article is based on RTX Corp’s Q2 2026 financial report and is intended for informational purposes only. It does not constitute investment advice. Investors should consult their own financial advisers and review the full official filings and disclosures before making any investment decisions. All forward-looking statements are subject to risks and uncertainties, and actual results may differ materially.