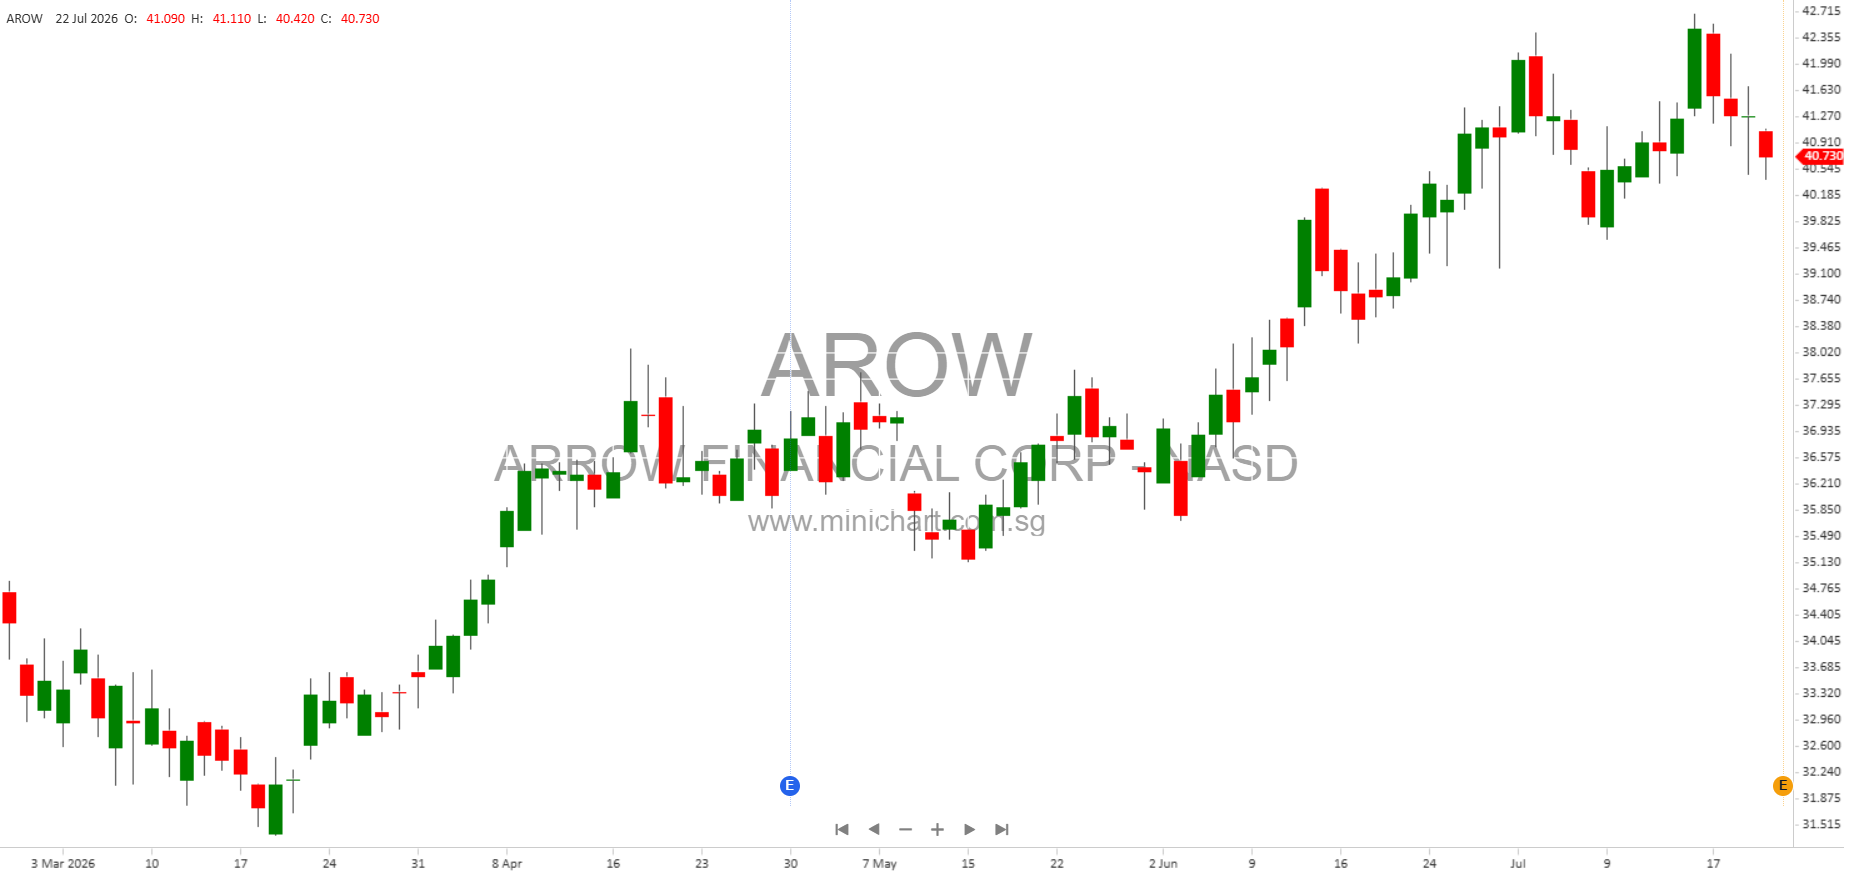
Arrow Financial Corporation Reports Q2 2026 Earnings: Acquisition, Credit Event, and Growth in Focus
Key Financial Highlights
- Net income for Q2 2026: \$11.0 million, or \$0.66 per diluted share
- Adjusted EPS (excluding merger expenses): \$0.71
- Quarterly cash dividend declared: \$0.30 per share, payable August 25, 2026
- Acquisition completed: Adirondack Bancorp, Inc. and Adirondack Bank (closed July 1, 2026)
- Merger-related expenses: \$1.0 million (\$0.05 per share)
- Loan growth: \$57.6 million in Q2 (6.7% annualized)
- Net interest income: \$35.9 million (down 0.6% from Q1 2026)
- Net interest margin (FTE): 3.43% (down from 3.48% in Q1 2026)
- Insurance revenue (1H26 vs. 1H25): Up 12.6%
- Wealth management revenue (1H26 vs. 1H25): Up 9.9%
- Return on average assets (ROA): 0.99% (1.06% adjusted for merger expenses)
- Non-performing assets: \$8.7 million (0.19% of assets, up from \$4.9 million in Q1)
Strategic Developments and Events
Adirondack Bank Acquisition: Expansion and Integration
Arrow Financial completed the acquisition of Adirondack Bancorp, Inc. and Adirondack Bank. This transaction, effective July 1, 2026, added approximately \$1.0 billion in assets and 19 new branch locations to Arrow’s footprint in upstate New York. Management expects the acquisition to be significantly accretive to EPS starting in 2027 and to provide increased growth opportunities through a high-quality, low-cost deposit base. The integration process will continue through the year, with associated merger-related expenses impacting near-term results.
Credit Event: Specific Reserve for Isolated Commercial Real Estate Credit
Second-quarter results were negatively impacted by a \$1.6 million (\$0.08 per share) specific reserve related to a single commercial real estate loan. The borrower and guarantors entered bankruptcy in June 2026, prompting Arrow to move a \$3.8 million loan to non-performing status and record the reserve. This event increased non-performing assets to \$8.7 million and raised the allowance for credit losses to \$36.2 million (1.03% of loans). Net charge-offs were 0.08% annualized, with overall credit metrics remaining strong.
Detailed Financial Performance
Income Statement Trends
- Net income decreased from \$13.5 million in Q1 to \$11.0 million, primarily due to the increased provision for credit losses and merger-related expenses. Lower non-interest income and a slight decline in net interest income also contributed to the decrease.
- Net interest income was \$35.9 million, down 0.6% from Q1, due to lower average earning assets and increased non-performing loans. Net interest margin declined to 3.43% (FTE), mainly from a seasonal shift toward higher-cost deposits and the impact of the non-performing loan.
- Provision for credit losses rose sharply to \$2.8 million (from \$0.5 million in Q1), driven by the specific commercial real estate credit and loan growth.
- Non-interest income fell slightly to \$8.3 million, reflecting seasonal insurance fluctuations and a \$0.3 million property impairment charge, partially offset by higher interchange fees and investment gains.
- Non-interest expense increased to \$27.5 million, including \$1.0 million in merger expenses.
- Provision for income taxes was \$2.9 million (21.1% effective rate), down from \$3.9 million (22.3%) in Q1, benefiting from energy production tax credits and offset by some non-deductible merger expenses.
Balance Sheet and Capital
- Total assets: \$4.5 billion (down 0.9% from Q1, due to lower cash and deposit balances)
- Total loans: \$3.5 billion (up \$57.6 million from Q1, led by commercial lending growth)
- Allowance for credit losses: \$36.2 million (1.03% of loans)
- Total deposits: \$3.7 billion (down \$358.7 million from Q1, mainly from replacing \$300 million in brokered CDs with lower-cost FHLB borrowings and seasonal municipal deposit outflows)
- Total stockholders’ equity: \$446.3 million (up \$6.2 million from Q1)
- Regulatory capital ratios: Common Equity Tier 1 Capital Ratio at 13.21%, Total Risk-Based Capital Ratio at 14.98% – well above regulatory minimums
Operational and Asset Quality Metrics
- Efficiency ratio: 62.02% (59.83% adjusted for merger expenses)
- Return on average tangible equity: 10.46% (down from 13.23% in Q1)
- Net loans charged-off to average loans (annualized): 0.08%
- Non-performing loans to period-end loans: 0.24%
- Allowance for credit losses to non-performing loans: 435.89%
- BauerFinancial rating: Arrow Bank maintained its 5-Star Superior rating for the 77th consecutive quarter
Management Commentary
“The Arrow team delivered another quarter of strong operating results. While our results were negatively impacted by recognizing a reserve on one isolated commercial credit, the credit metrics of the loan portfolio remain strong with low charge-offs and low non-performing loan balances. The overall health and trajectory of the business continues to perform well. I am particularly excited about the return to significant loan growth and the closing of our acquisition of Adirondack Bank, which will provide us with increased growth opportunities. We look forward to expanding our market with this high-quality, low-cost deposit franchise, adding approximately \$1.0 billion to our balance sheet. We expect the transaction to provide significant EPS accretion in 2027 and beyond. Arrow remains well-positioned to deliver shareholder value and execute on its strategic initiatives to build a premier banking franchise for its customers and the communities it serves.”
Key Shareholder and Investor Considerations
- Acquisition Impact: The Adirondack Bank deal is transformative, expanding Arrow’s asset base by \$1.0 billion and branch network by 19 locations. Management projects the deal will be materially accretive to EPS beginning in 2027, which could have a significant positive effect on share value over the medium term.
- Credit Event: The \$1.6 million reserve for a single commercial real estate credit is a negative event, but management stresses it is isolated. Investors should monitor Arrow’s asset quality and watch for any further credit deterioration, though current metrics remain strong.
- Loan and Revenue Growth: Strong loan growth and increases in insurance and wealth management revenues are positive indicators for future earnings power.
- Capital Strength: Capital ratios remain well above regulatory requirements, supporting both organic and acquisitive growth, as well as ongoing dividend payments.
- Dividend Stability: The declared \$0.30/share dividend continues Arrow’s consistent payout history.
Potential Price-Sensitive Issues
- Successful integration of Adirondack Bank will be key for realizing projected EPS accretion in 2027 and beyond.
- Single large credit event in the commercial real estate portfolio could raise investor concerns about credit risk, though management asserts it is isolated.
- Loan and deposit trends – continued loan growth is positive, but deposit outflows and reliance on wholesale funding should be watched.
Conclusion
Arrow Financial Corporation’s second quarter 2026 results reflect a transitional period marked by a significant acquisition, robust loan and noninterest revenue growth, and a one-off credit loss. The company remains well-capitalized, maintains strong asset quality metrics, and continues to deliver for shareholders through dividends and disciplined growth. The successful integration of Adirondack Bank and management of credit risk will be key drivers for share performance in the coming quarters.
Disclaimer: This article is for informational purposes only and does not constitute investment advice or a recommendation to buy or sell any security. Investors should conduct their own research and consult a qualified financial advisor before making investment decisions. The information is based on company filings and public disclosures as of the date referenced. Future performance is subject to risks and uncertainties including, but not limited to, economic conditions, integration of acquisitions, and credit events.