Northrim BanCorp Reports Record Second Quarter 2026 Results
Key Financial Highlights and Investor Insights
- Net income: \$15.3 million, or \$0.68 per diluted share, up from \$13.7 million (\$0.61/share) in Q1 2026 and \$11.8 million (\$0.52/share) in Q2 2025.
- Net interest income: \$37.1 million, up 7% quarter-over-quarter and 11% year-over-year. Net interest margin on a tax equivalent basis (NIMTE) increased to 5.01%, well above peer averages.
- Return on average assets (ROAA): 1.84% (Q1: 1.69%, Q2 2025: 1.48%)
- Return on average equity (ROAE): 17.77% (Q1: 16.60%, Q2 2025: 16.37%)
- Portfolio loans: \$2.39 billion, up 1% QoQ and 8% YoY
- Total deposits: \$2.92 billion, up 2% QoQ and 4% YoY
- Efficiency ratio: 59.44% (improved from Q1’s 61.81%)
- Book value per share: \$15.63 (up from \$15.10 in Q1 2026)
- Tangible book value per share: \$13.34 (up from \$12.81 in Q1 2026)
- Dividend per share: \$0.16 (unchanged from prior quarters)
- Opened new branch in Palmer, Alaska: Northrim’s 21st branch, expanding market presence.
Segment Performance
Community Banking
- Net interest income: \$33.2 million (up 11% YoY)
- Other operating expenses decreased 6% YoY, mostly due to lower personnel costs and improved regulatory capital ratios.
- Provision for credit losses: \$503,000 (up from Q1, down from Q2 2025)
- Net income for segment: \$11.7 million (\$0.52/share), six months: \$22.2 million (\$0.99/share)
- Portfolio loans in segment grew, with qualitative factors adjusted for increased nonperforming loans.
Home Mortgage Lending
- Mortgage loans funded for sale: \$239.1 million (up from \$123.4 million in Q1, consistent with Q2 2025)
- Net interest income: \$3.5 million (up from Q1, flat YoY)
- Provision for credit losses: \$279,000 (down from Q1 and Q2 2025)
- Segment net income: \$1.6 million (\$0.07/share), six months: \$3.1 million (\$0.12/share)
- Mortgage servicing portfolio: \$1.66 billion
- Expansion markets (AZ, CO, NW): Represented 27% of Q2 2026 production
Specialty Finance
- Average purchased receivables and loan balances: \$141.5 million (up from Q1 and Q2 2025)
- Segment net income: \$2.0 million (\$0.09/share), six months: \$4.1 million (\$0.18/share)
- Total revenue: \$7.6 million in Q2, \$14.3 million in six months
Asset Quality and Credit Risk
- Nonperforming assets (NPAs) net of government guarantees: \$23.0 million (up from \$15.3 million in Q1 and \$11.9 million in Q2 2025).
- Allowance for credit losses on loans: 117% of nonperforming loans (down from 175% in Q1, 290% in Q2 2025).
- Net loan charge-offs: \$111,000 in Q2 2026 (down from Q1, up from Q2 2025).
- Adversely classified loans: \$33.4 million (stable YoY).
- Direct oil & gas exposure: \$128.6 million (5% of portfolio loans), only \$0.4 million adversely classified.
- Uninsured deposits: \$1.14 billion (39% of total deposits, up from 38% at end of 2025).
Balance Sheet and Liquidity
- Total assets: \$3.42 billion (up 2% QoQ, 5% YoY)
- Loan-to-deposit ratio: 82% (up from 78% a year ago)
- Liquidity: \$1.11 billion in liquid assets/investments/loans maturing within one year; \$560.6 million available for borrowing
- Shareholders’ equity: \$347.6 million
- Tier 1 Capital to Risk Adjusted Assets: 11.26% (well-capitalized)
- Tangible common equity to tangible assets: 8.82%
Alaska Economic Update
- Unemployment rate: 4.6% (vs US 4.3%)
- Aggregate personal income: \$60 billion (+2.9% YoY), per capita \$81,386 (11th highest in US)
- Gross State Product: \$78.8 billion (+2.1% real growth, US avg 2.7%)
- Exports: \$6.7 billion (+13.4% YoY); South Korea, Australia, Japan top importers; China’s imports fell 47% due to tariffs
- ANS crude oil price surged to \$114.66/barrel in May 2026 (geopolitical conflicts); production forecast to rise to 621k bpd by FY2036
- Alaska Permanent Fund: \$92.2 billion, scheduled \$3.8-\$4 billion contribution to General Fund
- Anchorage home prices: \$567,221 (up 6.5% YTD); Matanuska Susitna Borough: \$440,217 (up 2.9%)
- Housing activity: Anchorage units sold up 1%, Matanuska Susitna Borough units sold down 1.9%
Management Commentary
“Another quarter of record net interest income and continued loan and deposit growth reflects the strength of our relationship-driven banking model and our disciplined execution,” said Mike Huston, President and CEO. “Investments in people, technology and customer relationships continue to drive profitable growth, expand our market presence, and create long-term value for shareholders. The opening of our Palmer branch further strengthens our ability to serve communities across Alaska.”
“We saw a slight increase in our loan yields as a result of loan repricing and investment yields from new higher yield purchases. We are also continuing to see impacts from the decrease in our deposit costs from maturing of higher priced time deposits,” said Jed Ballard, CFO. Northrim’s NIMTE remains substantially above peer averages.
Potential Share Price Movers & Risks
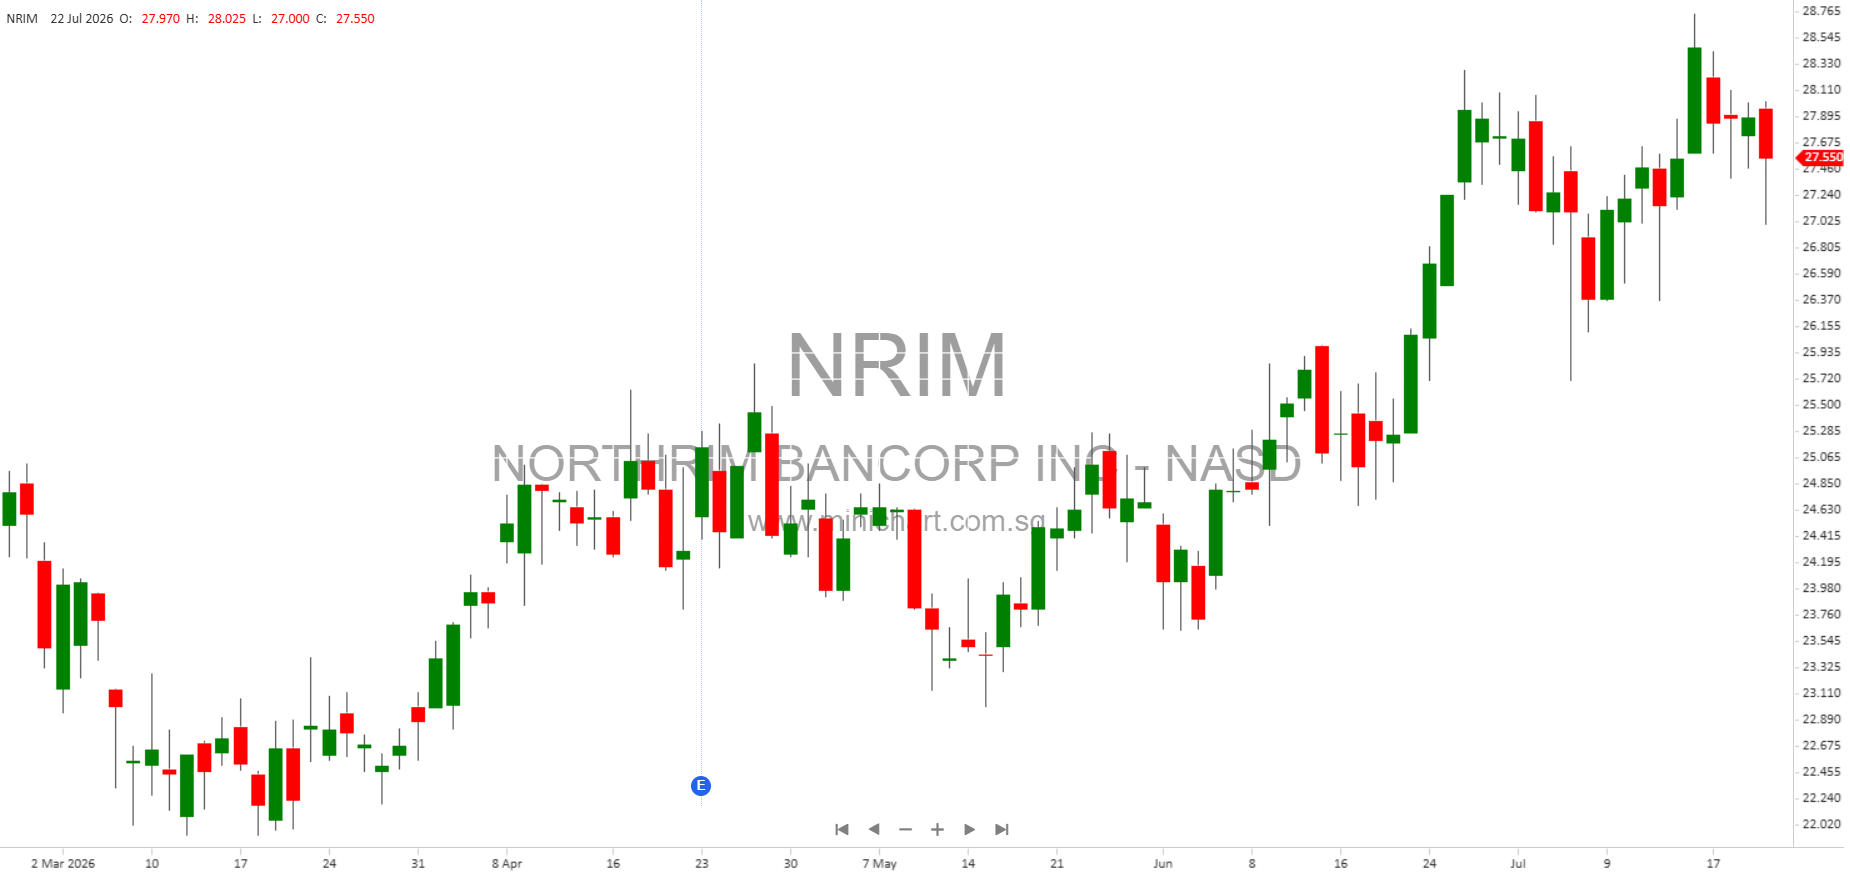
- Record net interest income, margin, and profitability: Outperformance vs peers may attract investors seeking strong regional banks.
- Loan and deposit growth: Consistent expansion in core businesses and new branch openings signal continued growth.
- Asset quality concerns: NPAs rose sharply during the quarter, mostly due to a single relationship; allowance coverage ratio has declined. Investors should monitor credit quality trends.
- Mortgage segment volatility: Mortgage banking income increased, but servicing revenues declined and fair value adjustments were negative. Future mortgage activity could impact earnings.
- Oil & gas exposure: While direct exposure is limited and mostly performing, Alaska’s economy is sensitive to commodity prices and geopolitical risks.
- Uninsured deposits: Relatively high percentage (39%) could be a risk in turbulent environments.
- Dividend sustainability: Dividend maintained at \$0.16/share, but payout ratio and future earnings trends should be watched.
- No share repurchases planned in 2026: May disappoint investors seeking capital return; earnings are being retained.
- Regulatory and economic risks: Forward-looking statements highlight risks related to rising rates, credit quality, inflation, geopolitical instability, and changes in Alaska’s economy.
Conclusion
Northrim BanCorp delivered record results in the second quarter of 2026, beating peers in profitability, loan growth, and net interest margin. The bank’s continued expansion in Alaska and investment in its core segments support a positive outlook. However, rising nonperforming assets, declining coverage ratios, and economic uncertainties pose risks that investors should monitor closely. The strong capital base and liquidity suggest resilience, but credit quality and mortgage segment volatility may impact future share performance.
Disclaimer: This article is for informational purposes only and does not constitute investment advice. All investment decisions should be made based on individual risk tolerance and financial circumstances. Past performance is not indicative of future results. Investors should consult Northrim BanCorp’s official filings and disclosures for complete details and review risk factors outlined in SEC filings. The author of this article does not hold a position in Northrim BanCorp.