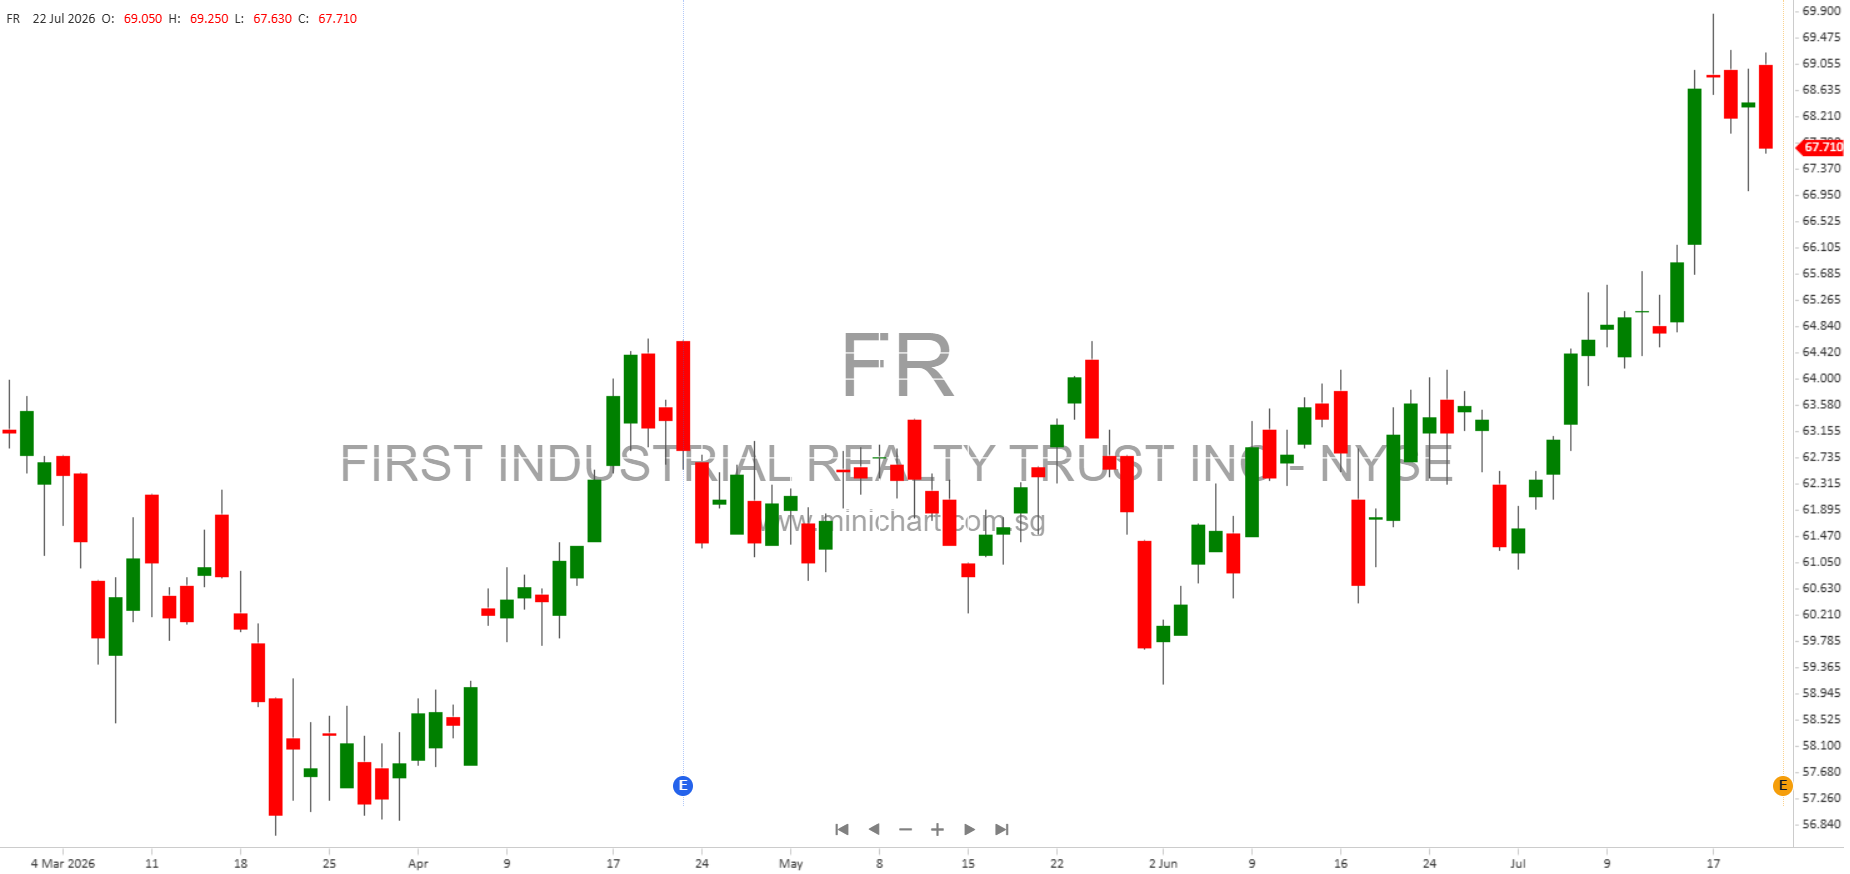
First Industrial Realty Trust, Inc. Reports Strong Second Quarter 2026 Results
Key Highlights
- EPS Growth: Diluted net income per share increased to \$0.58 in Q2 2026, up from \$0.42 in Q2 2025.
- FFO Growth: Funds from operations (FFO) rose to \$0.82 per share/unit (diluted), compared to \$0.76 a year ago.
- Cash Rental Rate Surge: Cash rental rates on new and renewal leases soared by 39% in Q2 2026, with a similar increase (39%) on leases signed for 2026 starts, covering 80% of expirations by square footage.
- Strong Same Store NOI: Cash basis same store net operating income (SS NOI) before termination fees rose 6.7% year-over-year, driven by higher rental rates, contractual rent escalations, and reduced free rent.
- Portfolio Occupancy: In-service occupancy climbed to 94.9% at quarter end, up from 94.3% in Q1 2026 and 94.2% in Q2 2025.
Operational and Leasing Successes
- Major Leasing Achievements:
- Leased 100% of its 708,000 SF facility in Central Pennsylvania.
- Leased 100% of 155,000 SF First Wilson Logistics Center II in Inland Empire.
- Leased 56,000 SF of its 198,000 SF First Park Miami Building 3 in South Florida.
- Leased 100% of 220,000 SF First Park New Castle Building B in Philadelphia.
- Leased remaining 31,000 SF of 60,000 SF First Pompano Logistics Center in South Florida.
- Leased 100% of 176,000 SF First Park 121 Building F in Dallas (commences Q3).
- Development and Investment Activity:
- Commenced development of First Park New Castle Building A (Philadelphia): 613,000 SF, \$77 million estimated investment.
- Acquired newly constructed 161,000 SF value-add building in Dallas for \$26 million.
- Acquired 58-acre land site in Baltimore for \$39 million, expected to support 629,000 SF across three buildings.
- Closed a 100-acre income-producing land sale in Phoenix for \$131 million, roughly triple industrial land values.
- Sold four Detroit buildings (310,000 SF) for \$29 million.
Financial Guidance and Outlook for 2026
- FFO Guidance Raised: On the strength of Q2 results, the Company increased its 2026 FFO guidance by \$0.02 per share/unit at the midpoint.
- 2026 Guidance Ranges:
- Net Income: \$2.48 – \$2.56 per share/unit.
- NAREIT FFO: \$3.08 – \$3.16 per share/unit.
- FFO before advisory costs: \$3.12 – \$3.20 per share/unit.
- SS NOI growth on cash basis: 5.25% – 6.25% (up 25 bps at midpoint).
- Average quarter-end in service occupancy projected at 94.0% – 95.0%.
- G&A expense expected at \$42 – \$43 million, excluding \$5.6 million contested proxy costs recognized in Q1.
- Capitalization and Exclusions: Company plans to capitalize \$0.08 per share of interest related to completed and under-construction developments. Guidance excludes impacts from future investments, property sales, debt/equity issuances, or repurchases post-press release.
Balance Sheet and Financial Data
- Balance Sheet (end Q2 2026):
- Gross Real Estate Investments: \$6.47 billion.
- Total Assets: \$5.78 billion.
- Total Debt: \$2.57 billion.
- Total Liabilities: \$2.91 billion.
- Total Equity: \$2.87 billion.
- Dividends: Common dividends/distributions per share/unit were \$0.50 in Q2 2026 (\$1.00 for six months), up from \$0.445 in Q2 2025 (\$0.89 for six months).
Shareholder Information: Price Sensitive Points
- Significant Lease-Ups: Leasing of major facilities, especially the 708,000 SF Central Pennsylvania property and full-building deals in key markets, signals robust demand and may positively impact future earnings and valuation.
- Rental Rate Growth: The 39% jump in cash rental rates on new and renewal leases is a major positive for income growth and valuation multiples.
- Development Pipeline: The start of a \$77 million, 613,000 SF Philadelphia development and strategic acquisitions (Dallas, Baltimore) highlight First Industrial’s commitment to growth and value creation.
- Asset Dispositions: The Phoenix land sale (\$131 million, triple prior land values), and Detroit building sales (\$29 million) provide capital for redeployment and may impact NAV.
- FFO Guidance Increase: Raising FFO guidance is a direct signal of confidence in operational momentum—often viewed as price sensitive by investors.
- Dividend Growth: The increase in dividends suggests improving cash flows and shareholder returns.
- Contested Proxy Costs: \$5.6 million in advisory costs related to a contested proxy campaign were recognized in Q1. Excluding these, core EPS and FFO would be higher.
Supplemental Performance Measures
First Industrial uses supplemental performance metrics such as Funds From Operations (FFO), Adjusted Funds From Operations (AFFO), Net Operating Income (NOI), and Adjusted EBITDA. These measures are widely used by real estate investors to gauge cash flow, value, and operational efficiency. FFO and AFFO adjustments include depreciation, amortization, gains/losses on sales, equity in joint ventures, interest, capitalized overhead, and non-incremental capital expenditures. Same Store NOI is used to analyze rental growth and property-level performance, excluding straight-line rent, amortization, and lease termination fees. These metrics are not GAAP measures and may vary across companies.
Forward-Looking Statements
The report contains forward-looking statements regarding economic conditions, leasing activity, occupancy, rental growth, capital allocation, and risks including economic volatility, interest rates, legislation, supply chain developments, and competitive environment. Investors are cautioned not to place undue reliance on these statements. Actual results may differ materially due to various risk factors, including those disclosed in SEC filings.
Conference Call
First Industrial will host its second quarter conference call on July 23, 2026, at 11:00 a.m. EDT. Details for access are available on the company’s website.
Disclaimer
This article is based on publicly released financial and operational data from First Industrial Realty Trust, Inc. and is intended for informational purposes only. Forward-looking statements are subject to risks and uncertainties. Readers should consult the company’s SEC filings and other disclosures before making investment decisions. This article does not constitute financial advice or a recommendation to buy or sell shares.