Vera Bradley, Inc. Reports Q1 FY2027 Financial Results: Returns to Growth and Delivers Major Profit Improvements
First Quarter Financial Highlights
- First consolidated quarterly net revenue growth since Fiscal 2022: Net revenues rose 7.8% year-over-year to \$55.7 million.
- Significant margin and profitability improvements: Non-GAAP gross margin expanded 430 basis points. SG&A expense declined by nearly 15%. Operating loss improved by \$10 million, or 76% year-over-year.
- Inventory management and cash flow: Inventory reduced by 26% to \$73.0 million, the lowest Q1 level since fiscal 2011. Operating cash flow improved by \$12.7 million (70%).
- Customer growth and channel performance: Direct segment comparable sales increased 13.4%, with the first customer growth in direct channels since 2021. Strategic collaborations with Bath and Body Works and Target drove 80% new customer acquisition in these partnerships.
- Operating results: Non-GAAP net loss from continuing operations improved to (\$2.5) million, or (\$0.09) per diluted share, compared to (\$10.1) million, or (\$0.36) per share, in the prior year.
- Guidance raised: The company now expects at least 50% year-over-year improvement in non-GAAP operating loss for FY2027, up from previous guidance of 40%.
CEO Perspective and Strategic Progress
CEO Ian Bickley attributed the momentum to the ongoing “Project Sunshine” transformation, which aims to recapture Vera Bradley’s brand optimism and drive operational excellence. Bickley emphasized the importance of this quarter as a turning point, marking the first quarterly revenue growth since Q4 FY22 and the first direct-channel customer growth since 2021.
The company has successfully impacted nearly 80% of its spring collection with new initiatives, and it is seeing positive engagement from key partnerships with major retailers. Bickley stated: “Our strategic collaborations with Bath and Body Works and Target ignited strong engagement, with approximately 80% of customers who engaged through these partnerships being new to Vera Bradley.”
The CEO also noted prudent cost management and a continued focus on the five strategic pillars of transformation as central to the company’s turnaround progress.
Detailed Financial Performance
Revenue and Segment Performance
- Consolidated Net Revenues: \$55.7 million, up from \$51.7 million in Q1 FY2026.
- Direct Segment: Revenues grew 4.1% year-over-year to \$44.9 million, with a 13.4% increase in comparable sales—driven by improved ecommerce conversion, higher average ticket, and increased store traffic. Three underperforming full-line stores were closed during the quarter.
- Indirect Segment: Revenues surged 26.6% to \$10.8 million, propelled by stronger performance in specialty and department stores and continued growth across key accounts via cut-to-order sales.
Profitability and Cost Management
- Gross Profit: \$28.8 million (51.8% of net revenues) vs. \$22.8 million (44.1%) last year. Non-GAAP gross profit in the prior year was \$24.6 million (47.5%). Margin improvement was due to better sales mix and lower freight/duty costs.
- SG&A Expenses: \$34.1 million (61.3% of net revenues), down from \$40.8 million (79.0%). Non-GAAP SG&A was \$32.7 million (58.8%), a substantial reduction enabled by cost optimization, lower personnel costs, adjusted marketing spend, and reduced lease expenses from store closures and negotiations.
- Operating Loss: (\$4.6) million, or (8.3%) of revenues, a dramatic improvement from (\$17.9) million, or (34.6%), last year. Non-GAAP operating loss was (\$3.3) million, compared to (\$13.6) million previously.
-
By Segment:
- Direct: Operating income of \$3.1 million (6.9% of direct revenues) vs. a loss of (\$5.5) million (-12.9%) last year; non-GAAP, \$3.5 million (7.7%) vs. (\$2.8) million (-6.6%).
- Indirect: Operating income of \$4.0 million (37.0% of segment revenues) vs. \$2.0 million (23.1%) last year; non-GAAP, \$4.1 million (38.1%) vs. \$2.2 million (26.1%).
Balance Sheet and Cash Flow
- Cash and Cash Equivalents: \$12.5 million as of May 2, 2026, compared to \$11.3 million a year ago. No borrowings on the company’s ABL facility at quarter-end.
- Inventory: \$73.0 million, a 26% reduction (lowest Q1 level since 2011), due to improved planning and sales, as well as a \$5.3 million Project Restoration inventory reserve.
- Net Capital Spending: \$0.3 million, down from \$1.9 million last year, reflecting fewer store relocations.
Fiscal Year 2027 Guidance and Outlook
- Net Sales Guidance: Expected range of \$255 million to \$270 million. Guidance reflects the decision to not hold the annual outlet sale event and the restructuring of the wholesale business under new leadership, with reduced reliance on liquidation channels.
- Operating Loss Improvement: The company now expects at least a 50% year-over-year improvement in non-GAAP operating loss versus the FY2026 loss of (\$21.7) million, up from previous guidance of 40% improvement.
- Profitability Drivers: Continued operational improvements, better gross profit and SG&A rates, and strategic focus on core business lines.
Other Noteworthy Items for Shareholders
- Project Sunshine Progress: The turnaround is gaining momentum, and management is confident in returning to long-term sustainable growth, profitability, and positive cash flow.
- Customer Acquisition: Partnership-driven customer acquisition is robust, with 80% of new engagement from Bath and Body Works and Target collaborations representing first-time Vera Bradley customers.
- Store Optimization: The company is actively closing underperforming stores, renegotiating leases, and optimizing its physical footprint.
- Inventory Actions: Inventory has been actively managed, with the leanest levels in over a decade, reducing carrying costs and supporting cash flow improvement.
- Non-GAAP Adjustments: The company provides detailed reconciliations for non-GAAP metrics, which exclude items such as severance, transformation costs, professional fees for the Pura Vida sale, and other one-time costs.
Risks and Forward-Looking Statements
Management notes that forward-looking statements involve risks, including possible adverse economic conditions, unpredictable changes in consumer demand, loss of key personnel, execution risks related to strategic initiatives, store optimization, tariffs, cost inflation, supply chain disruptions, and macroeconomic shocks. For further details, investors should review risk factors in the company’s filings.
The company will hold a conference call and webcast to discuss results and outlook, and provides ongoing updates via its investor relations website.
Conclusion
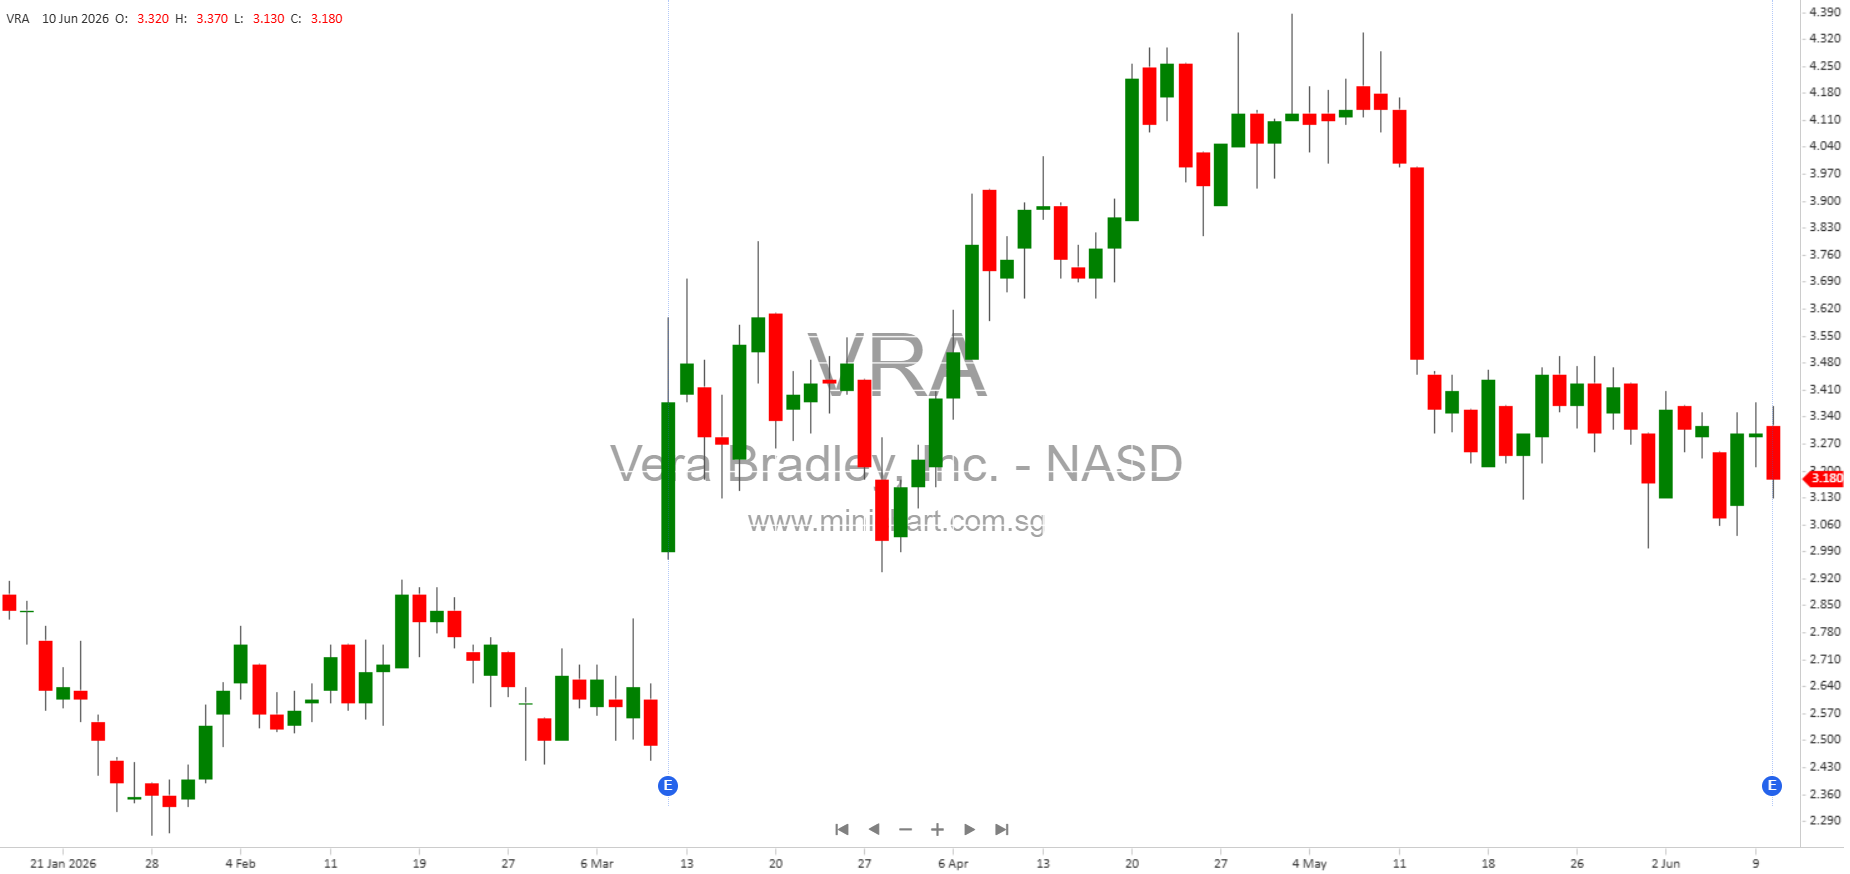
Key price-sensitive takeaways for shareholders: Vera Bradley’s return to quarterly revenue growth for the first time since FY2022, dramatic operating loss improvement, and raised guidance for FY2027 operating loss improvement represent significant positive inflection points. The company’s transformation is delivering tangible results, and its ongoing focus on profitability, cash flow, and customer acquisition could positively impact share value.
Disclaimer: This article is for informational purposes only and does not constitute investment advice. Investors should conduct their own due diligence and consult with professional advisors before making any investment decisions. Vera Bradley, Inc.’s results and forward-looking statements are subject to risks and uncertainties as outlined in their public filings.