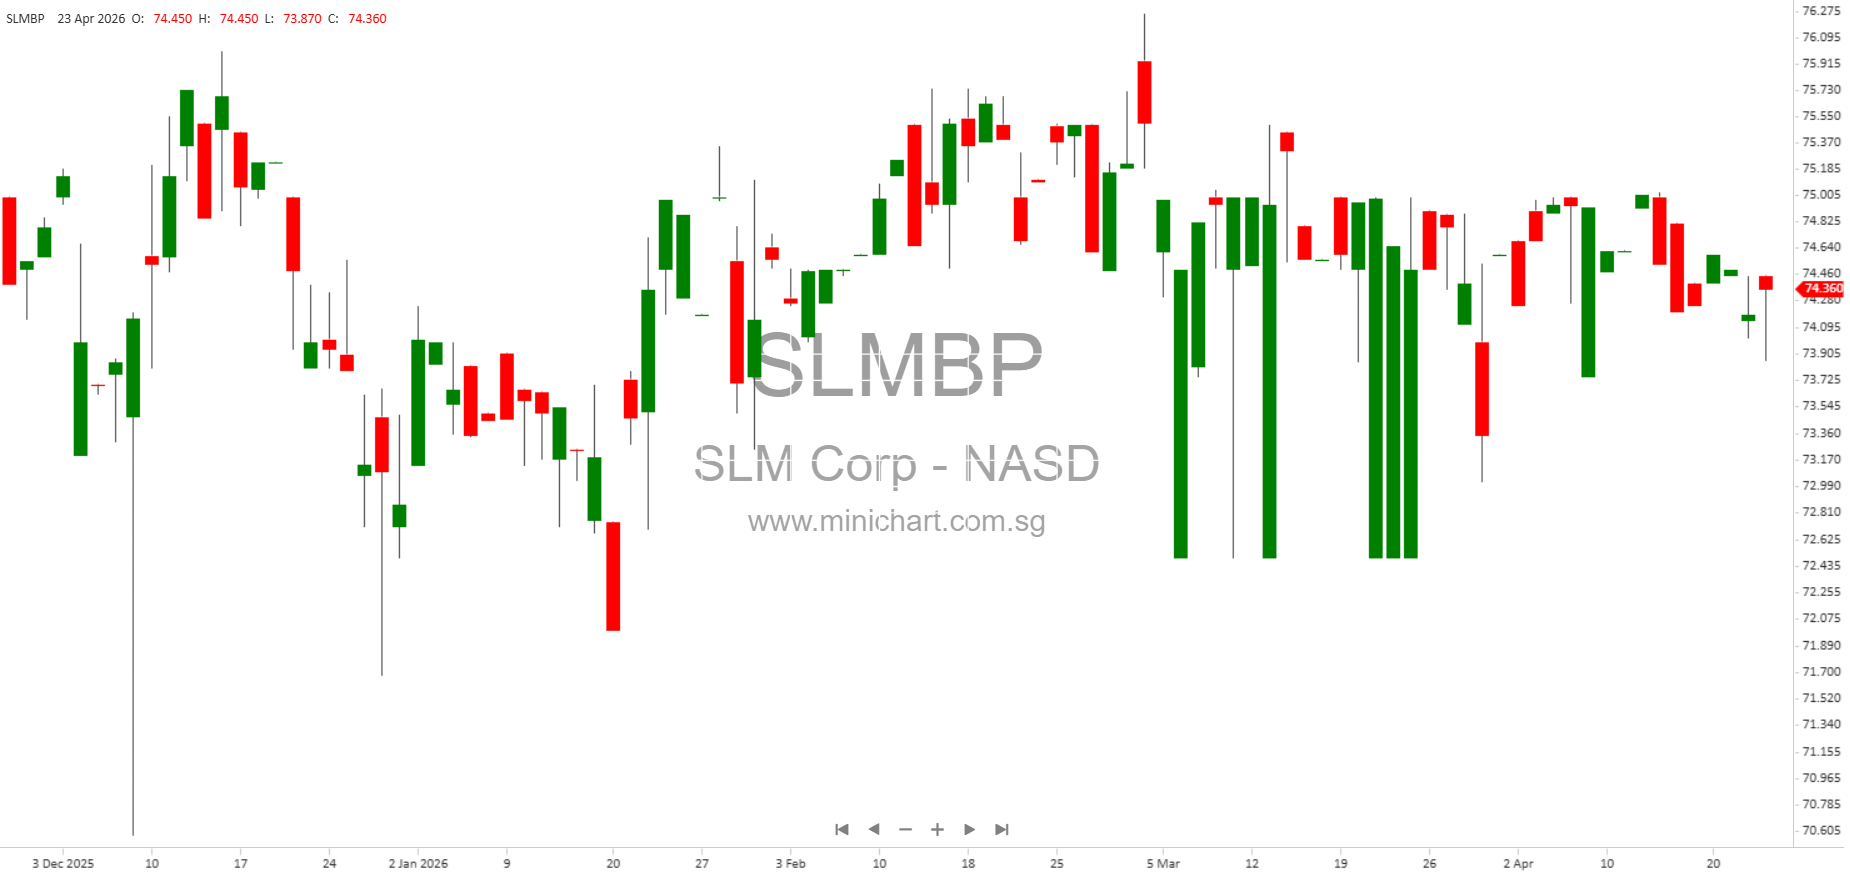
Sallie Mae (SLM) Delivers Strong Q1 2026 Results, Raises Full-Year Guidance
NEWARK, Del., April 23, 2026 — Sallie Mae (Nasdaq: SLM), formally SLM Corporation, released robust financial results for the first quarter of 2026 and notably raised its full-year diluted earnings per common share guidance, signaling positive momentum and confidence in the company’s ongoing strategy and market position.
Key Financial Highlights
- GAAP Diluted Earnings Per Common Share: \$1.54 for Q1 2026, up from \$1.40 in the same period last year.
- Private Education Loan Originations: Gained 5% compared to Q1 2025, reflecting strong demand for private education financing.
- Net Charge-Offs: \$89 million, consistent with company expectations and prior guidance.
- Non-Interest Expenses: \$171 million, up from \$155 million in Q1 2025 but in line with full-year expectations.
- Average Loans Outstanding (Net): \$23.3 billion during the quarter.
Strategic and Operational Highlights
- Strong Loan Sales: Loan sales generated a \$146 million gain, supporting earnings and enhancing capital flexibility.
- Net Interest Margin: 5.29%, reflecting effective balance sheet management and lower cost of funds (4.13%).
- Shareholder Returns:
- Repurchased 12.0 million shares of common stock for \$259 million in Q1 2026.
- Entered a \$200 million accelerated share repurchase (ASR) in March 2026, with an initial delivery of 8.4 million shares.
- Quarterly dividend of \$0.13 per share paid to shareholders.
- \$242 million of repurchase capacity remains under the 2026 program as of March 31, 2026.
- Private Education Loan Sales: \$3.3 billion in Q1 2026, compared to \$2.0 billion in Q1 2025.
- Delinquencies: 3.98% of loans in repayment were delinquent in Q1 2026, up from 3.58% in Q1 2025.
- Loans in Hardship Forbearance: 0.99% in Q1 2026, slightly higher than 0.92% in Q1 2025.
Updated 2026 Guidance
In a significant and potentially share price-moving update, Sallie Mae raised its full-year 2026 diluted EPS guidance. The company now expects:
- Diluted EPS: \$3.10 – \$3.20 (up from prior guidance)
- Private Education Loan Originations Growth: 12% – 14% year-over-year
- Net Charge-Offs: \$345 – \$385 million
- Non-Interest Expenses: \$750 – \$780 million
These updates reflect management’s confidence in the company’s resilience and growth prospects, with CEO Jonathan Witter stating that the results “underscore the strength and durability of our strategy and franchise.”
Quarterly Financial Summary Table
| Q1 2026 | Q4 2025 | Q1 2025 |
|---|---|---|
| Total Interest Income: \$649M | \$657M | \$656M |
| Net Interest Income: \$375M | \$377M | \$375M |
| Non-Interest Income: \$185M | \$77M | \$206M |
| Net Income: \$308M | \$233M | \$305M |
| Preferred Stock Dividends: \$4M | \$4M | \$4M |
| Net Income Attributable to Common Stock: \$304M | \$229M | \$301M |
| Private Education Loans Held for Investment, Net: \$19.9B | \$20.3B | \$21.1B |
| Deposits: \$20.5B | \$21.1B | \$20.1B |
| Net Interest Margin: 5.29% | 5.21% | 5.27% |
| Efficiency Ratio: 30.6% | 34.6% | 26.6% |
| Return on Assets (ROA): 4.2% | 3.1% | 4.2% |
| Return on Common Equity (ROCE): 56.4% | 42.2% | 60.1% |
Balance Sheet Position (as of March 31, 2026)
- Total Assets: \$29.4 billion
- Total Liabilities: \$27.0 billion
- Total Equity: \$2.44 billion
- Cash and Cash Equivalents: \$5.16 billion (up from \$4.24 billion at Dec 31, 2025)
- Common Stockholders’ Equity (before treasury stock): \$6.54 billion
- Treasury Stock: 256.8 million shares at cost
Risks and Forward-Looking Statements
Management cautions that all forward-looking statements are subject to risks and uncertainties, many of which are beyond the company’s control. Key risks include changes in regulations, economic conditions, credit market fluctuations, competitive pressures, cybersecurity threats, and the effectiveness of risk management frameworks. Investors are urged to consider these factors when evaluating the company’s prospects.
What Investors Should Watch
- Upward revision in full-year EPS guidance is a significant positive and may affect share valuation.
- Strong capital returns through share repurchases and dividends demonstrate management’s commitment to shareholder value.
- Loan growth and profitability metrics remain robust, but slight increases in delinquencies and forbearances should be monitored as potential risk factors.
- Efficiency and return metrics (ROA, ROCE) remain strong, supporting potential for continued outperformance.
Disclaimer: This article is for informational purposes only and does not constitute investment advice or a recommendation to buy or sell any securities. Investors should review official filings and consult their financial advisors before making investment decisions. All forward-looking statements are subject to risks and uncertainties that could cause actual results to differ materially.