S&T Bancorp, Inc. Reports Strong Q1 2026 Results: Robust Earnings, Deposit Growth, and Continued Share Repurchases
Key Highlights for Investors
- Net Income Growth: S&T Bancorp, Inc. recorded net income of \$35.1 million for Q1 2026, up from \$34.0 million in Q4 2025 and \$33.4 million in Q1 2025. Diluted EPS rose to \$0.94, representing increases of 5.6% quarter-over-quarter and 8.0% year-over-year.
- Strong Return Metrics: Return on average assets (ROA) was 1.44%, return on average equity (ROE) reached 9.77%, and return on average tangible shareholders’ equity (ROTE, non-GAAP) stood at 13.22%—all improvements from Q4 2025.
- Pre-Provision Net Revenue (PPNR): To average assets (non-GAAP) was 1.87%, compared to 1.95% in Q4 2025.
- Net Interest Margin (NIM): On a fully taxable equivalent basis (FTE, non-GAAP), NIM was 3.92%, remaining strong but slightly lower than the 3.99% posted in Q4 2025.
- Deposit Growth: Total deposits increased by \$226.4 million (11.5% annualized), with customer deposit growth of \$306.5 million (16.0% annualized). This was partially offset by a reduction in brokered deposits by \$80.1 million.
- Loan Portfolio: Total portfolio loans decreased \$112.6 million, attributed to lower fundings, reduced utilization rates, and higher commercial real estate payoffs.
- Significant Drop in Net Charge-Offs: Net charge-offs were \$1.7 million (0.09% of average loans), a dramatic reduction from \$11.0 million (0.54%) in Q4 2025.
- Improved Asset Quality: Nonperforming assets (NPAs) decreased by \$5.7 million to \$49.9 million (0.63% of total loans plus OREO), down from \$55.6 million (0.69%) at year-end 2025.
- Substantial Share Repurchases: S&T repurchased 1,146,100 common shares for \$49.6 million in Q1 2026. For Q4 2025 and Q1 2026 combined, share repurchases totaled 2,094,370 shares at an average price of \$40.99, totaling \$85.8 million. Remaining capacity under the current buyback program is \$50.4 million.
- Capital Position: All regulatory capital ratios remain comfortably above well-capitalized thresholds, with tangible common equity/tangible assets (non-GAAP) at 11.03% and Tier 1 leverage ratio at 11.82%.
Detailed Financial Performance
Net Interest Income and Margin
Net interest income for Q1 2026 was \$88.4 million, down from \$91.0 million in Q4 2025. The decline was attributed to two fewer days in the quarter and an interest recovery on a previously charged-off loan that occurred in Q4 2025. Average interest-earning assets rose by \$57.0 million to \$9.2 billion, but the yield on these assets declined by 14 basis points to 5.60%, reflecting lower loan rates. Meanwhile, the cost of interest-bearing liabilities fell by 12 basis points to 2.54%, due to reduced deposit costs and lower reliance on brokered deposits and borrowings.
Asset Quality & Credit Losses
The allowance for credit losses (ACL) was \$93.3 million (1.17% of total portfolio loans), nearly unchanged from year-end. The provision for credit losses dropped sharply to \$1.3 million from \$5.7 million in Q4 2025, primarily due to lower net charge-offs. Nonperforming assets are at a manageable level and continue to trend downward.
Noninterest Income and Expense
Noninterest income slipped to \$13.6 million, attributed to seasonally lower debit and credit card fees. Noninterest expense decreased to \$56.7 million, mainly due to lower salary and benefits expenses.
Balance Sheet and Capital Management
- Total assets: \$9.9 billion, unchanged from December 31, 2025.
- Cash and due from banks: Increased by \$175.6 million, reflecting the deposit increase and loan portfolio decline.
- Commercial loan portfolio: Decreased by \$79.0 million, primarily from a \$94.7 million drop in commercial real estate loans, partially offset by a \$23.9 million rise in commercial construction loans.
- Consumer loan portfolio: Fell by \$33.6 million, mainly due to lower residential mortgage and consumer construction balances.
- Customer deposit growth: Reflected increases in core relationships, temporary commercial customer funds, and seasonal inflows from tax refunds.
- Borrowings: Decreased by \$115.0 million to \$150.3 million, reflecting higher deposit balances.
Shareholder Returns
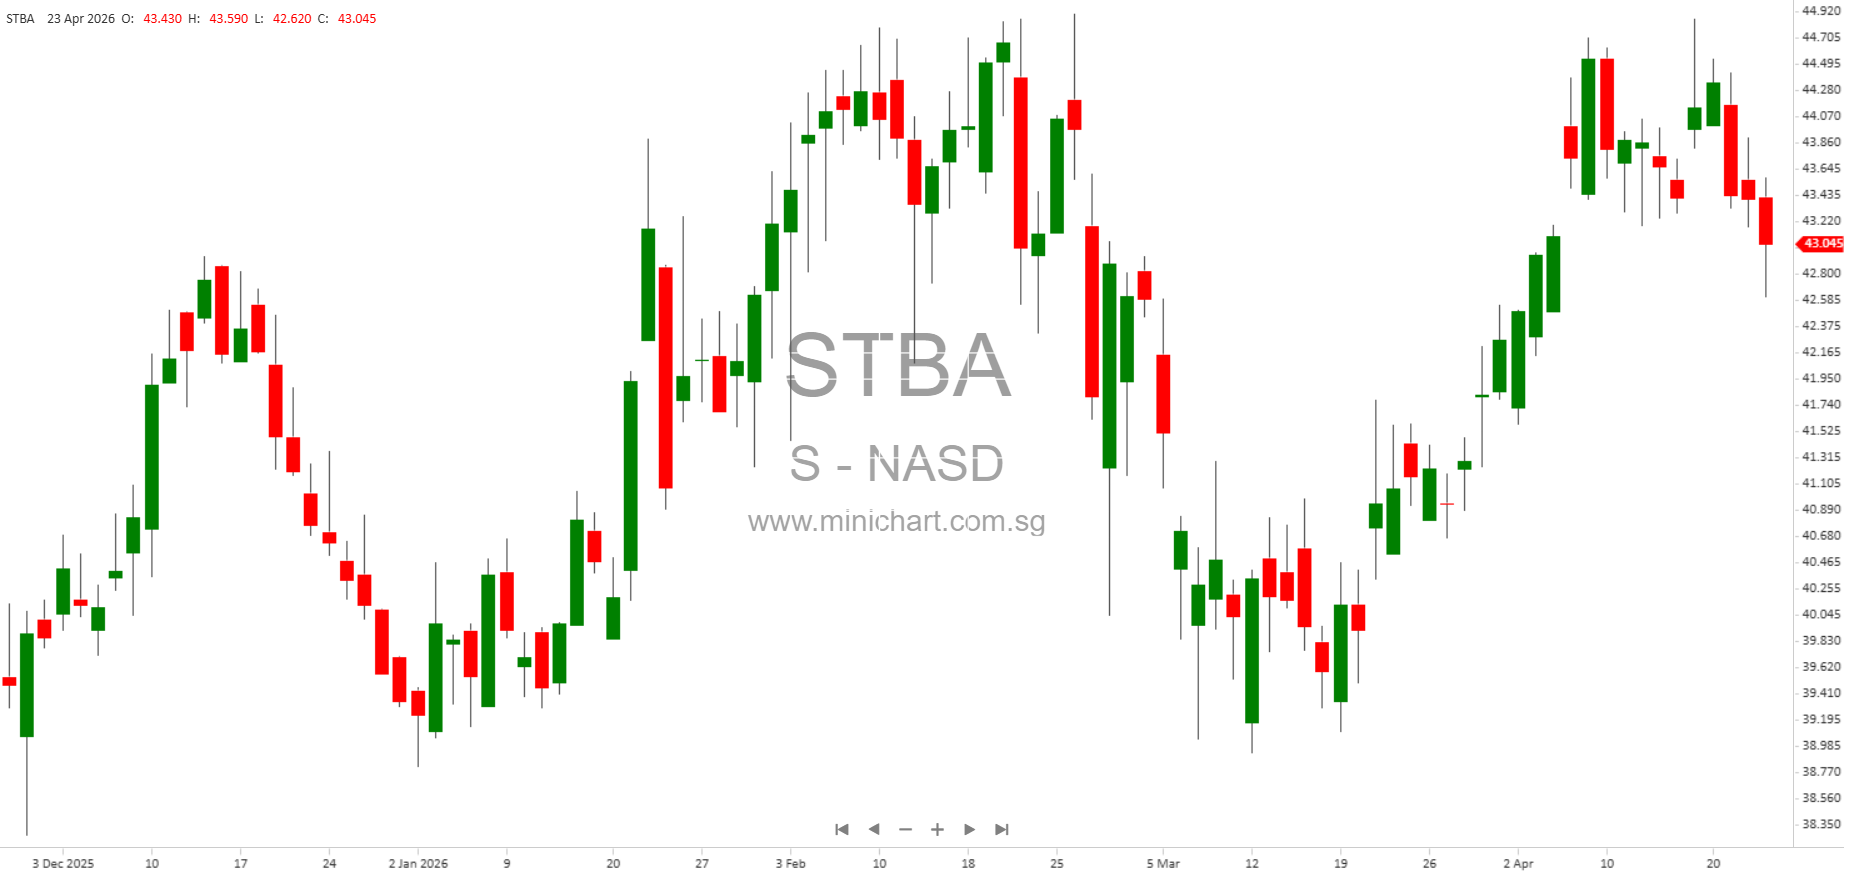
The company’s aggressive share repurchase activity is a highlight, with 1,146,100 shares repurchased in Q1 2026 at an average price of \$43.30. Over the past two quarters, total repurchases have approached \$86 million, indicating strong confidence in the company’s valuation and future prospects. The remaining buyback capacity is \$50.4 million.
Dividends remain steady at \$0.36 per share, with a dividend yield (annualized) of 3.44% and a payout ratio of 38.09%.
Management Commentary
“The first quarter delivered strong earnings performance, solid return metrics and robust deposit growth, underscoring the team’s commitment to our strategic priorities,” said CEO Chris McComish. “Grounded in our people-forward approach to banking, we remain focused on deepening relationships and delivering meaningful value to our customers, communities and shareholders.”
Potential Share Price Sensitivities
- Robust Earnings and Efficiency: The continued strength in earnings, improved efficiency ratio (55.23% FTE non-GAAP), and high returns on equity and assets may positively influence investor sentiment and support share price appreciation.
- Deposit Growth Outpacing Peers: Strong organic deposit growth—especially in noninterest-bearing and money market accounts—demonstrates franchise strength and could be viewed as a competitive advantage in the current banking environment.
- Significant Share Buybacks: The scale of recent share repurchases is likely to be price-supportive, reducing supply and signaling management’s confidence in intrinsic value.
- Improved Asset Quality: The sharp reduction in net charge-offs and NPAs should reassure investors about credit risk and the quality of the loan portfolio.
- Stability of Capital Position: All capital ratios remain well above regulatory minimums, reducing concerns about balance sheet risk or regulatory intervention.
- Potential Risks: Although credit metrics are currently favorable, the company acknowledges risks related to interest rates, economic conditions, regulatory changes, and potential credit losses in its forward-looking statements.
Conference Call and Further Information
S&T Bancorp will host a live webcast for its Q1 2026 earnings call at 1:00 p.m. ET on April 23, 2026. The webcast will be archived for 12 months on the company’s Investor Relations webpage.
S&T Bancorp, Inc. is a \$9.9 billion bank holding company headquartered in Indiana, Pennsylvania, and trades on NASDAQ under the symbol STBA. Its principal subsidiary, S&T Bank, operates in Pennsylvania and Ohio.
Disclaimer
This article contains forward-looking statements based on current expectations and assumptions, which are subject to risks and uncertainties. Actual results may differ materially. Investors should review the company’s filings and consider all risk factors. This article is for informational purposes only and does not constitute investment advice or a recommendation to buy or sell any security.