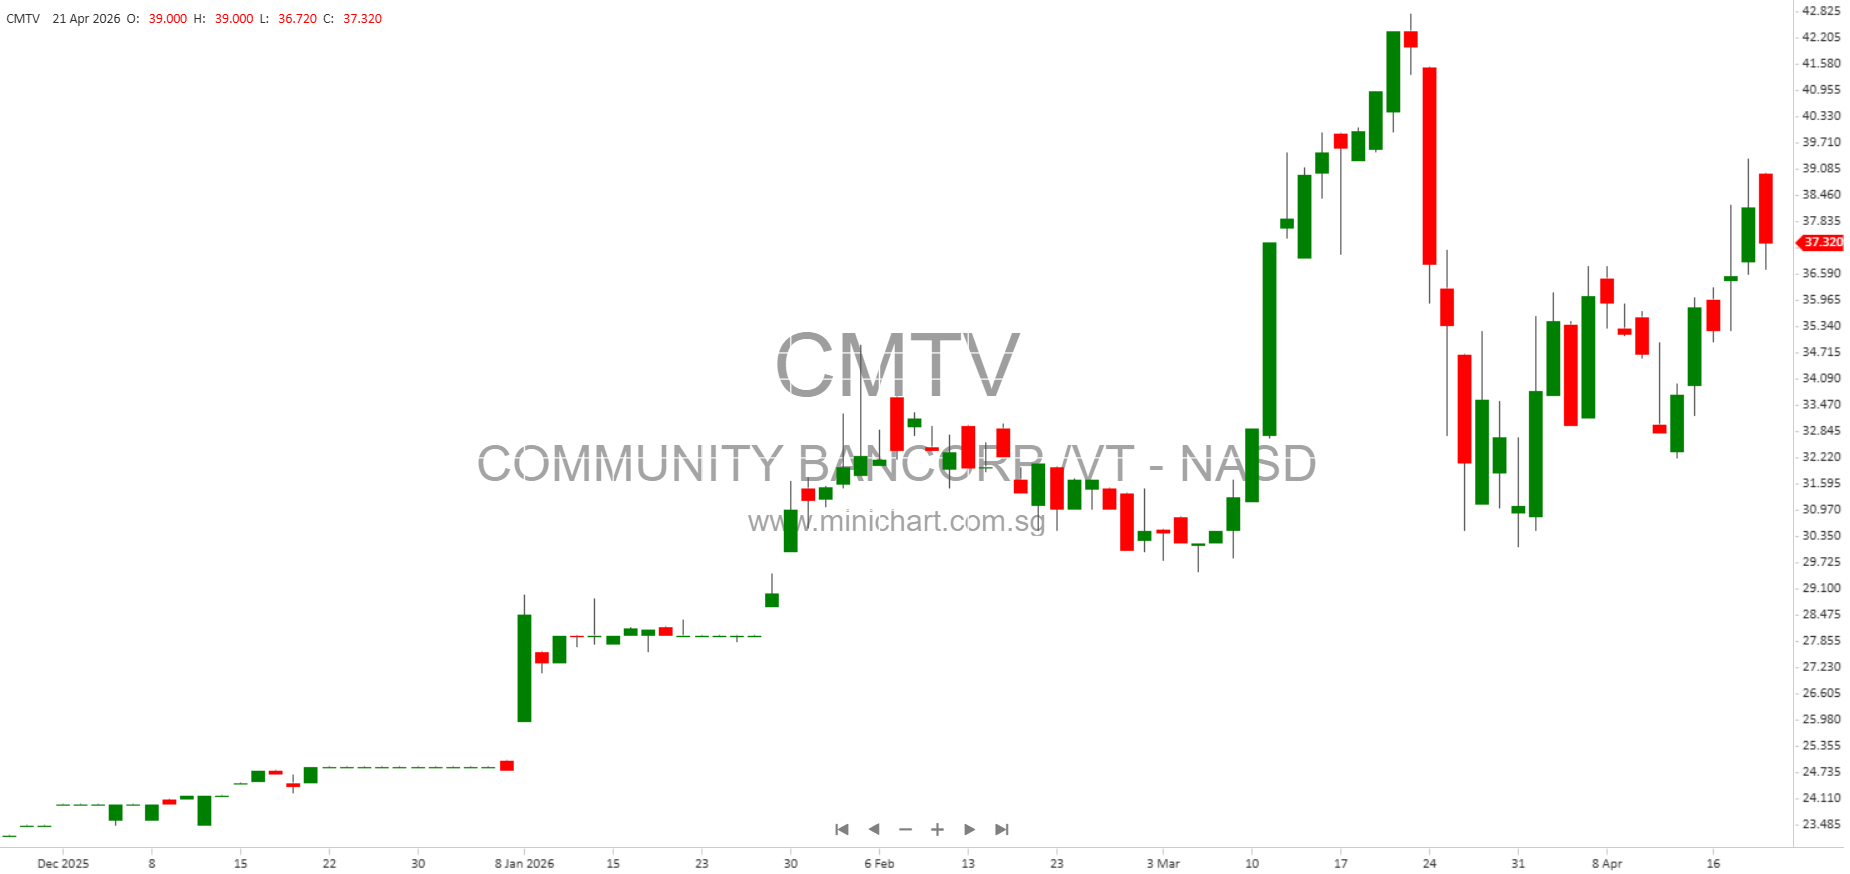
Community Bancorp. Reports Strong Q1 2026 Earnings: Key Details for Investors
Derby, VT, April 21, 2026 — Community Bancorp. (NASDAQ: CMTV), the parent company of Community National Bank, has released its financial results for the first quarter ended March 31, 2026, reporting robust year-over-year growth in profits, assets, and tangible book value. The results mark a continuation of the company’s strong operational momentum, underpinned by significant growth in its loan portfolio and a strategic uplisting to the Nasdaq Capital Markets exchange.
Key Financial Highlights and Metrics
- Net Income: Q1 2026 net income reached \$4.4 million (\$0.78 per share), up 23.93% from \$3.5 million (\$0.62 per share) in Q1 2025.
- Return on Average Assets (ROAA): 1.42%
- Return on Average Equity (ROE): 15.31%
- Pre-tax, Pre-provision Net Revenue Return on Average Assets: 1.83%
- Net Interest Margin: 3.81%
- Efficiency Ratio: 57.4%
- Noninterest Expense to Average Assets: 2.29%
- Dividend Payout: 31.96%
- Fully Diluted Tangible Book Value per Common Share: \$18.81 (up 4% in Q1)
- Total Capital to Risk-Weighted Assets: 15.63%
- Total Assets: \$1.24 billion (down \$52.3 million from year-end 2025, but up 3.99% year-over-year)
- Loan Portfolio Growth: Gross loans increased \$43.6 million, or 4.64% year-over-year
- Deposit Growth: Total deposits increased by \$38 million, or 3.89% year-over-year
- Dividend Declared: \$0.25 per share, payable May 2026 to shareholders of record as of April 26, 2026
Detailed Operational Review
Asset and Loan Growth
Despite a modest decrease in total assets since year-end 2025, the company’s asset base grew nearly 4% compared to Q1 2025, mainly driven by a \$43.6 million increase in its loan portfolio. This expansion was supported through a combination of cash, maturities in the securities portfolio, and an uptick in both core and brokered deposits.
Securities Portfolio and Equity Impact
The company’s available-for-sale securities portfolio declined to \$138 million at quarter-end (from \$145 million at year-end 2025), as maturing securities were utilized to fund loan growth. Notably, unrealized losses in the portfolio improved to \$9.8 million (a \$3.6 million improvement year-over-year), reflecting the positive market impact of bond rate changes on fair value. These losses are considered temporary and do not affect regulatory capital ratios.
Net Interest Income and Margin
Net interest income for Q1 2026 climbed 15.99% to \$11 million, up from \$9.4 million a year earlier. This was driven by higher interest and fees on loans (up 9.21% to \$14.4 million), reflecting both portfolio growth and improved yields, as well as increased interest on federal funds and overnight deposits.
Credit Quality and Provisioning
The provision for credit losses was \$391,505 for the quarter, up from \$325,054 in Q1 2025. The company continues to follow the Current Expected Credit Losses (CECL) methodology, as required by accounting standards.
Non-Interest Income and Expense
Non-interest income rose 11% to \$1.7 million, thanks to higher service fees, loan-related income, and other sources. Non-interest expenses increased to \$7.1 million (from \$6.5 million), with notable items including increases in salaries, benefits, and general operating costs. The efficiency ratio remains healthy at 57.4%.
Capital and Shareholder Returns
Equity capital increased to \$116.8 million, with a book value per share of \$20.88. Retained earnings grew by \$2.9 million in the current quarter and \$12.2 million year-over-year. The company redeemed all outstanding Series A preferred shares in Q4 2025, removing \$1.5 million in preferred equity from its capital structure.
Recent Strategic Moves
- Uplisting to Nasdaq Capital Markets: In Q1, Community Bancorp. successfully uplisted its shares to Nasdaq, a move that has increased trading liquidity and improved share price for investors.
- Dividend Increase: The company declared a quarterly cash dividend of \$0.25 per share, up from \$0.24 per share a year ago.
Management Commentary
“The first quarter of 2026 was a continuation of the strong performance of our bank. We continue to stress the value of relationship banking throughout our footprint. This quarter we were able to uplist to the Nasdaq Capital Markets exchange. This move has generated improved liquidity and price for our shareholders. Our performance continues to help us provide a strong return to our shareholders and our communities. We are pleased to see our tangible book value increase in the first quarter by 4% while our quarterly earnings per share increased by 26% compared to March 31, 2025. We remain committed to running a bank that our communities find helpful and beneficial while supporting our investors’ trust in our company.”
— President and CEO Christopher Caldwell
Key Shareholder Takeaways & Potential Price Sensitivity
- Significant earnings and tangible book value growth are positive indicators that can drive valuation multiples higher.
- Uplisting to Nasdaq is a material event, increasing the company’s visibility, liquidity, and potential institutional ownership, all of which can have a sustained impact on share price.
- Improvement in unrealized losses on securities and strong capital ratios indicate balance sheet resilience, reducing risk to shareholders.
- Dividend increase demonstrates management’s confidence in ongoing profitability and capital generation.
- Redemption of preferred shares improves the capital structure for common shareholders.
Financial Tables (Select Data)
| Metric | Q1 2026 | Q1 2025 |
|---|---|---|
| Net Income | \$4.37 million | \$3.53 million |
| Earnings per Share | \$0.78 | \$0.62 |
| Net Interest Income | \$10.95 million | \$9.44 million |
| Total Assets | \$1.24 billion | \$1.12 billion |
| Loans (Net) | \$973.4 million | — |
| Total Deposits | \$1.02 billion | — |
| Book Value per Share | \$20.88 | \$20.36 (Dec 2025) |
| Dividend Declared per Share | \$0.25 | \$0.24 |
| Efficiency Ratio | 57.4% | — |
Conclusion
Community Bancorp.’s Q1 2026 results highlight a period of strong profitability, prudent capital management, and strategic advances such as its Nasdaq uplisting. The company’s financial strength, robust loan and deposit growth, and rising shareholder returns may be considered positive catalysts for the share price. Investors should continue to monitor interest rate environments, credit quality trends, and regulatory developments, but current indicators point to a healthy operational outlook for the company.
Disclaimer: The information above is provided for informational purposes only and does not constitute investment advice or a recommendation to buy or sell securities. Investors should conduct their own research and consult with financial advisors before making investment decisions. Community Bancorp.’s forward-looking statements are subject to risks and uncertainties that could cause actual results to differ materially from those anticipated.