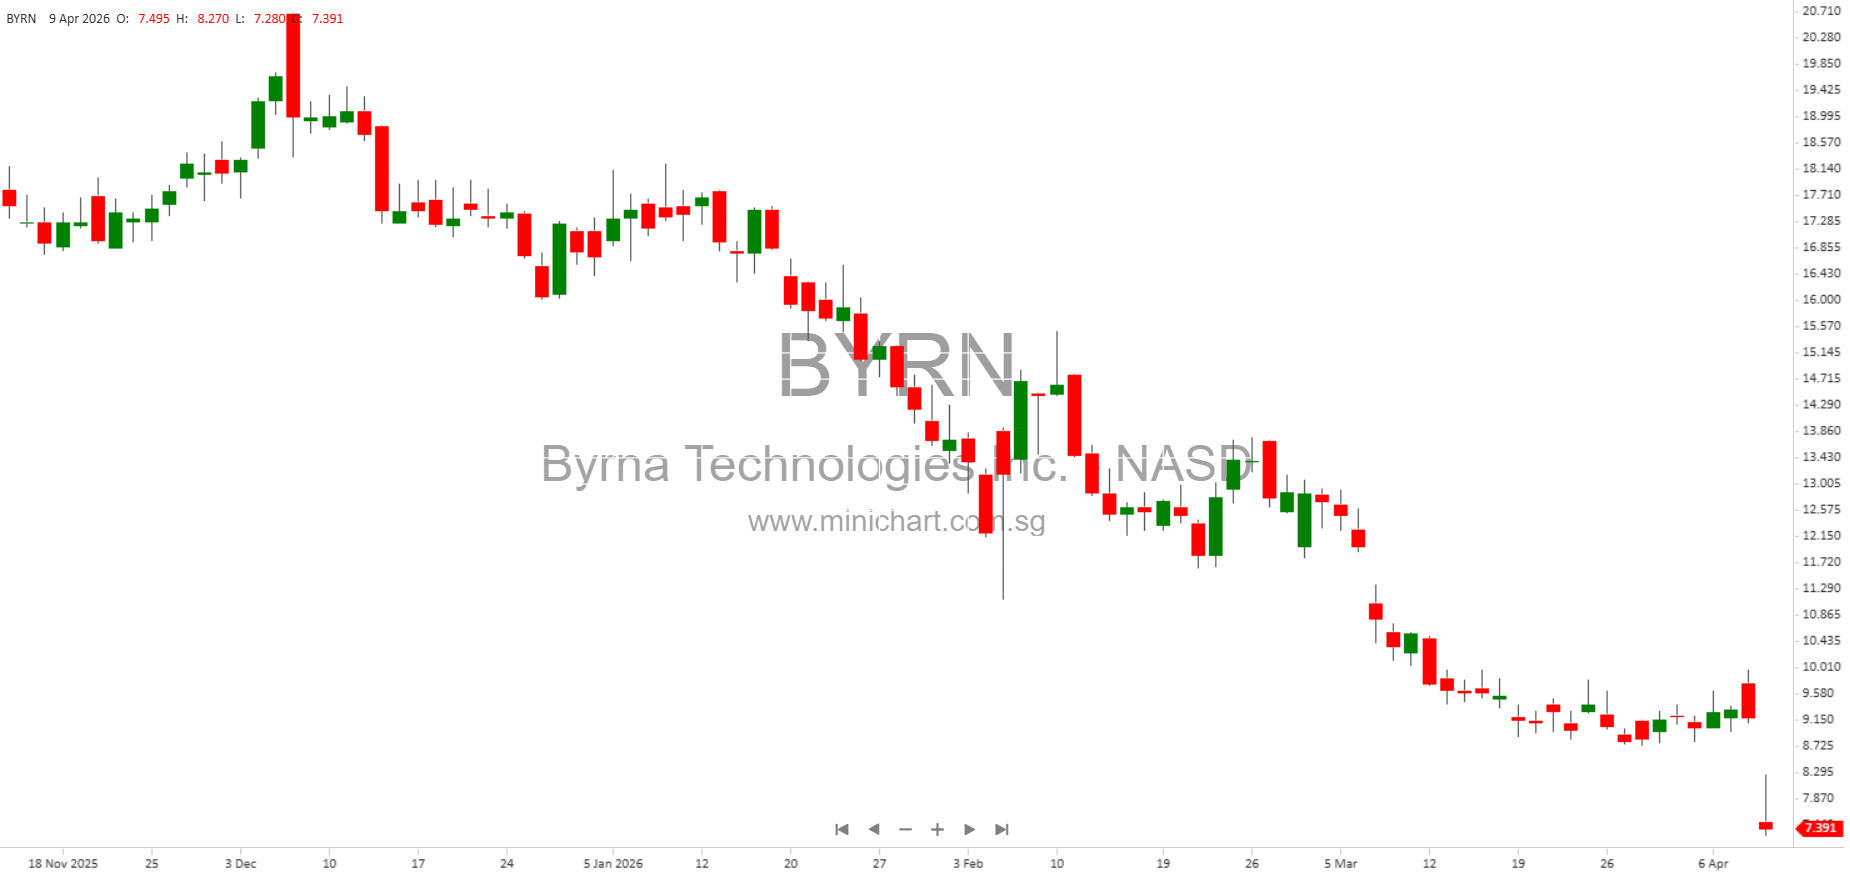
Byrna Technologies Inc. Announces Fiscal First Quarter 2026 Financial Results
Key Highlights for Investors
- Financial Performance:
- Net revenue for Q1 2026: \$29.05 million, an increase from \$26.19 million in Q1 2025.
- Gross profit: \$17.40 million, up from \$15.92 million in the prior year’s quarter.
- Operating income: \$0.93 million (Q1 2025: \$1.70 million).
- Net income: \$0.80 million, down from \$1.66 million.
- Non-GAAP adjusted EBITDA: \$1.34 million, compared to \$2.06 million in Q1 2025.
- Diluted earnings per share: \$0.03 (Q1 2025: \$0.07); Basic EPS: \$0.04 (Q1 2025: \$0.07).
- Balance Sheet Strength:
- Total assets as of February 28, 2026: \$79.9 million.
- Stockholders’ equity: \$79.9 million.
- Cash and marketable securities: \$2.16 million (includes \$400,000 in restricted cash and \$1.76 million in marketable securities).
- Operational Update:
- Byrna continues to see healthy website traffic on Byrna.com, but has experienced a decline in conversion rates and average order value in recent months, suggesting challenges in converting demand into sales.
- The company is investing in website enhancements, including a new ‘Find the Right Product’ tool to improve the customer journey, educate buyers, and increase conversion rates.
- Strategic Outlook and CEO Priorities:
- The new CEO, Conn Davis, has set a strategic priority to drive deeper penetration across retail and dealer channels, emphasizing this as the primary growth opportunity for the next 12–18 months.
- Byrna aims to broaden its brand message to attract a wider audience, leveraging improved web tools and data analytics to enhance customer education and sales conversion.
Important Considerations for Shareholders
- Revenue Growth but Margin Pressure: While quarterly revenues and gross profits increased, net income and EBITDA declined year-over-year, indicating rising costs and margin compression.
- Website Conversion Weakness: The decline in online conversion rates and average order values is a concern, especially as e-commerce remains a significant sales channel. The company’s initiatives to address this could impact future performance.
- Leadership Transition: With a new CEO in place, shareholders should monitor the effectiveness and execution of the strategic priorities outlined, especially those targeting retail and dealer expansion.
- Outlook and Risks: The company provided forward-looking statements about expected sales, execution risks with retail partners, and potential for future cost increases or demand fluctuations. These could materially impact future results and share value.
- Non-GAAP Measures: The company uses non-GAAP financial metrics such as adjusted EBITDA to supplement its financial reporting, but acknowledges these are not a substitute for GAAP results and may differ from similar measures used by other companies.
Potential Price-Sensitive Information
- Sales Growth vs. Profitability: The continued growth in net revenue, coupled with declining earnings and EBITDA, may raise questions about future profitability and operational efficiency, which can impact the share price.
- Execution of Strategic Plans: The success or failure of the new CEO’s strategy to expand retail and dealer channels, and to reverse declining web conversion metrics, could be significant share price drivers over the next 12–18 months.
- Risks Highlighted: The company cautions about the unpredictability of future events, including the possibility of order cancellations, cost increases, and cash flow restrictions, all of which could affect shareholder value.
Detailed Financial Tables (Selected Data)
| Q1 2026 | Q1 2025 | |
|---|---|---|
| Net Revenue | \$29,049,000 | \$26,190,000 |
| Gross Profit | \$17,401,000 | \$15,924,000 |
| Operating Expenses | \$14,228,000 | Not disclosed |
| Income from Operations | \$928,000 | \$1,696,000 |
| Net Income | \$801,000 | \$1,662,000 |
| Non-GAAP EBITDA | \$1,344,000 | \$2,056,000 |
| Basic EPS | \$0.04 | \$0.07 |
| Diluted EPS | \$0.03 | \$0.07 |
Forward-Looking Statements
Byrna’s management included statements regarding anticipated sales growth, the impact of strategic initiatives, and risks related to execution and market demand. The company warns investors not to place undue reliance on forward-looking statements, as actual results may differ due to a variety of factors, including those outlined in Byrna’s SEC filings under “Risk Factors.”
Contact
For further investor inquiries:
Tom Colton and Alex Wilson
Gateway Group, Inc.
949-574-3860
[email protected]
Disclaimer
This article is for informational purposes only and does not constitute investment advice. Investors should review the full filings and consult with their financial advisors before making any investment decisions. Past performance is not indicative of future results. Byrna Technologies’ forward-looking statements are subject to risks as outlined in its SEC filings.