Taylor Devices, Inc. Q3 2026 Financial Report: Key Investor Insights
Overview
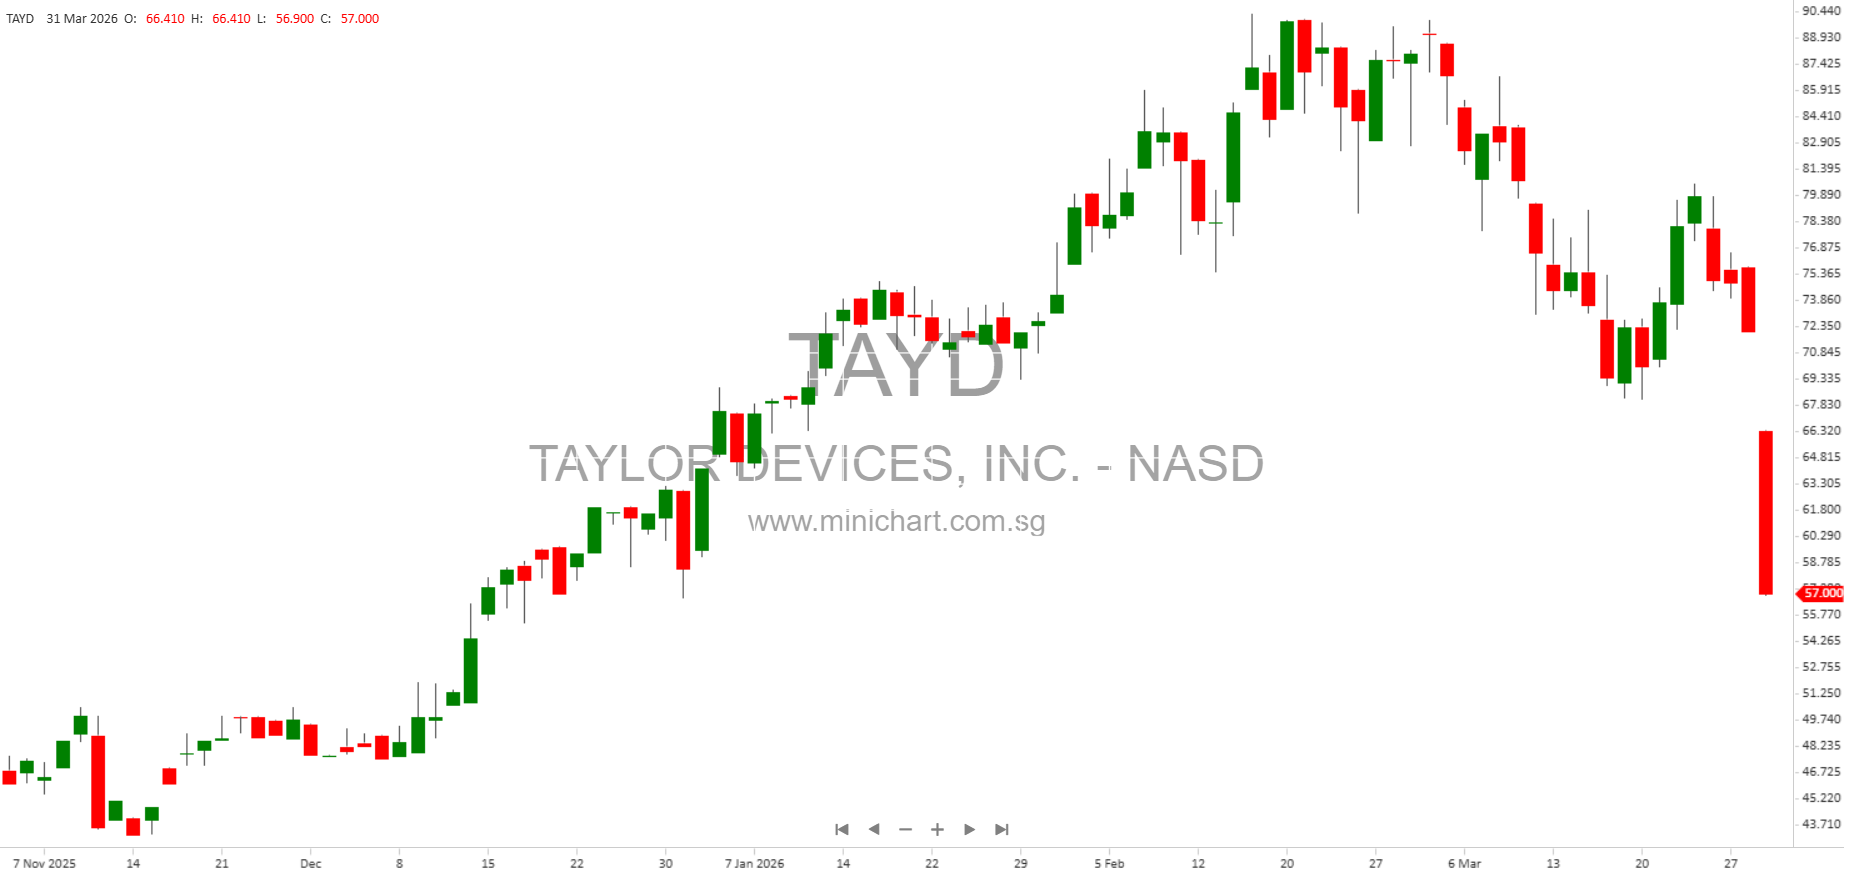
Taylor Devices, Inc. (NASDAQ: TAYD) has released its unaudited condensed consolidated financial statements for the third quarter ended February 28, 2026. The report provides a comprehensive look at the company’s financial position, operational performance, and liquidity. Notably, the company continues to operate as a non-accelerated filer and a smaller reporting company, with no indication of being a shell company. The number of shares outstanding as of March 31, 2026, was 3,219,182.
Financial Highlights
- Total Assets: \$75,452,711 as of February 28, 2026, up from \$71,618,120 as of May 31, 2025.
- Stockholders’ Equity: \$70,146,927 as of February 28, 2026, a significant increase compared to \$62,044,377 as of May 31, 2025.
- Net Income: \$6,696,848 for the nine months ended February 28, 2026, and \$2,498,140 for the three months ended February 28, 2026.
- Basic and Diluted Earnings Per Share: \$2.12 for the nine months ended February 28, 2026; \$0.79 for the three months ended February 28, 2026.
- Cash and Short-Term Investments: Cash, cash equivalents, and restricted cash totaled \$2,301,704 at quarter’s end. Short-term investments include money market funds, U.S. Treasury securities, and corporate bonds, stated at fair value.
Operational Performance
Taylor Devices posted robust results in Q3 2026, with notable increases in net income and equity. The company’s operating income for the three months ended February 28, 2026, was \$2,626,000, up from \$2,020,000 in the same period last year. This improvement is primarily attributable to lower selling, general, and administrative (SG&A) expenses.
SG&A and R&D Expenses
- SG&A Expenses: \$7,241,000 for the nine months ended February 28, 2026, down \$490,000 from the prior year (\$7,731,000). This reduction improved profitability and may be a positive signal for investors.
- Research & Development: \$358,000 for the nine months ended February 28, 2026, up from \$319,000 last year. However, R&D as a percentage of net revenue remains low at 1.1% (up slightly from 1.0%), indicating controlled spending in this area.
- For the three months ended February 28, 2026, R&D was \$147,000, down \$84,000 (-57%) from the prior year’s \$231,000, now representing only 0.6% of net revenue.
Other Income
- Other Income: \$1,231,000 for the nine-month period, a 22% increase driven by short-term investment interest income.
- For the three months, other income was \$422,000, a 30% increase from the prior year, also attributable to investment returns.
Liquidity and Capital Resources
The company’s liquidity position remains strong, with working capital primarily composed of cash and short-term investments, inventory, accounts receivable, and other operational assets/liabilities. No dividends or profit sharing have been or will be paid for the current fiscal year, which is a notable point for income-focused investors.
Shareholder and Price-Sensitive Information
- No Dividends: There is no provision for profit sharing, dividends, or any other benefits for this fiscal year. This may affect investor sentiment for those seeking regular income.
- Significant Increase in Equity: The substantial rise in stockholders’ equity and net income could be viewed positively by the market, suggesting improved financial health and value creation for shareholders.
- Reduction in SG&A: Lower operating expenses have directly contributed to higher profitability, which may be price sensitive and supportive of share value.
- Strong Investment Returns: The increase in other income, driven by higher interest from short-term investments, further bolsters earnings.
- No Defaults or Legal Issues: The company has not reported any defaults upon senior securities, mine safety disclosures, or legal proceedings that would negatively affect share value.
- Reporting Compliance: The company has filed all required reports and submitted all interactive data files as required by the SEC, indicating robust compliance and transparency.
- Share Count: As of March 31, 2026, there were 3,219,182 shares of common stock outstanding, which is important for per-share calculations and dilution analysis.
Forward-Looking Statements and Risks
The company has included cautionary statements regarding forward-looking information. Risks include reductions in customer capital budgets, changing product demand, increased competition, technological advances, and natural disasters. These factors, many of which are outside the company’s control, could materially affect future results. Investors are advised to consider these risks when making investment decisions.
Summary Table: Key Financial Metrics
| Metric | Q3 2026 | Q3 2025 | Change |
|---|---|---|---|
| Total Assets | \$75,452,711 | \$71,618,120 | +\$3,834,591 |
| Stockholders’ Equity | \$70,146,927 | \$62,044,377 | +\$8,102,550 |
| Net Income (9M) | \$6,696,848 | N/A | N/A |
| EPS (9M) | \$2.12 | N/A | N/A |
| SG&A | \$7,241,000 | \$7,731,000 | – \$490,000 |
| R&D | \$358,000 | \$319,000 | +\$39,000 |
| Cash & Equivalents | \$2,301,704 | N/A | N/A |
| Shares Outstanding | 3,219,182 | N/A | N/A |
Potential Share Price Drivers
- Strong net income and equity growth could positively impact share value.
- Reduction in SG&A and increased investment income signal improved operational efficiency and return on assets.
- No dividend payments may temper enthusiasm among income-seeking shareholders.
- Absence of legal, regulatory, or compliance concerns is a positive for risk-averse investors.
Conclusion
Taylor Devices, Inc.’s Q3 2026 report demonstrates solid financial performance, improved profitability, and enhanced equity. The company’s prudent expense management, strong liquidity, and investment returns are positive indicators for investors. However, the lack of dividend payments may be a concern for some shareholders. Overall, the financial results and operational improvements are likely to support share value and may attract investor attention.
Disclaimer: This article is for informational purposes only and does not constitute financial advice or a recommendation to buy or sell any securities. All information is based on unaudited financial statements and may be subject to change. Investors should consider their own financial circumstances and consult with a qualified advisor before making investment decisions. Forward-looking statements are subject to various risks and uncertainties; actual results may differ materially.