CSOP Investments III VCC Annual Performance Review (FY2025)
CSOP Investments III VCC oversees three sub-funds, two of which—CSOP iEdge Southeast Asia+ TECH Index ETF and CSOP Huatai-PineBridge SSE Dividend Index ETF—were active throughout 2025. The third, CSOP CSAM CSI A500 Index ETF, was formed late in the year and remained inactive as of 31 December 2025. This article analyzes the key financial highlights, performance trends, and noteworthy events disclosed in the 2025 annual report.
Key Financial Metrics and YoY Comparison
| Metric | FY2025 CSOP iEdge SEA+ TECH Index ETF |
FY2024 CSOP iEdge SEA+ TECH Index ETF |
YoY Change | FY2025 CSOP Huatai-PineBridge SSE Dividend ETF |
FY2024 CSOP Huatai-PineBridge SSE Dividend ETF |
YoY Change |
|---|---|---|---|---|---|---|
| Dividend Income | \$7,155,461 | \$2,154,982 | +232% | RMB 1,766,139 | RMB 1,511,989 | +17% |
| Other Income | \$588,733 | \$737,817 | -20% | RMB 20,877 | RMB 105,218 | -80% |
| Net Gains/(Losses) on Investments | (\$2,216,466) | \$15,402,132 | -114% | (RMB 2,094,074) | RMB 5,124,629 | -141% |
| Total Operating Expenses | \$3,097,041 | \$1,518,016 | +104% | RMB 835,194 | RMB 820,829 | +2% |
| Net Asset Value (Year End) | \$192.8M | \$370.0M | -48% | RMB 21.7M | RMB 41.5M | -48% |
| Total Return after Tax | \$1,182,154 | \$15,835,318 | -93% | (RMB 1,165,547) | RMB 5,909,572 | -120% |
| Expense Ratio | 1.24% | 1.24% | 0% | 2.69% | 2.73% | -0.04% |
| Turnover Ratio | 45.54% | 156.54% | -111 pp | 18.14% | 6.17% | +12 pp |
| Distribution/Dividend | Not disclosed | Not disclosed | – | Not disclosed | Not disclosed | – |
Historical Performance Trends
- CSOP iEdge SEA+ TECH Index ETF: Delivered a positive NAV return of 8.75% for the year, but underperformed its benchmark (index return: 9.71%). Since inception, the ETF yielded a 31.64% return versus the index’s 36.20%.
- CSOP Huatai-PineBridge SSE Dividend ETF: NAV return was negative at -3.08%, outperforming its index, which returned -5.45% for the year. Since inception, the ETF has returned 10.57% (index: 7.42%).
- Both funds saw a significant YoY drop in total return and net asset values, reflecting challenging market conditions and substantial net outflows.
Notable Fund Flows and Share Movements
- CSOP iEdge SEA+ TECH Index ETF: Share redemptions (\$216.8M) far exceeded new subscriptions (\$38.4M), resulting in a net outflow and a 48% drop in NAV.
- CSOP Huatai-PineBridge SSE Dividend ETF: Also experienced net redemptions, with NAV falling by 48% YoY.
- No share issuance for the CSOP CSAM CSI A500 Index ETF during the reporting period.
Related-Party Transactions and Directors’ Remuneration
- Management and custody fees were paid to the Manager and Custodian as per agreements. Bank balances were held with DBS Bank Limited. No director or related party held shares or had special arrangements to acquire shares.
- Directors’ fees for the iEdge SEA+ TECH Index ETF in 2025 were \$10,268 (2024: \$10,050) and for the Dividend Index ETF RMB 74,343 (2024: RMB 67,761).
Exceptional or Unusual Items
- Net losses on investments: Marked reversal from strong gains in 2024 to losses in 2025, especially for the tech ETF, reflecting broad market volatility and sector rotation.
- Other income: Decreased for both funds, especially in the Dividend ETF, likely driven by lower market activity and returns from ancillary sources.
- No derivatives usage, borrowings, or securities lending. No asset revaluation delays or exceptional earnings/expenses were reported.
Corporate Actions and Subsequent Events
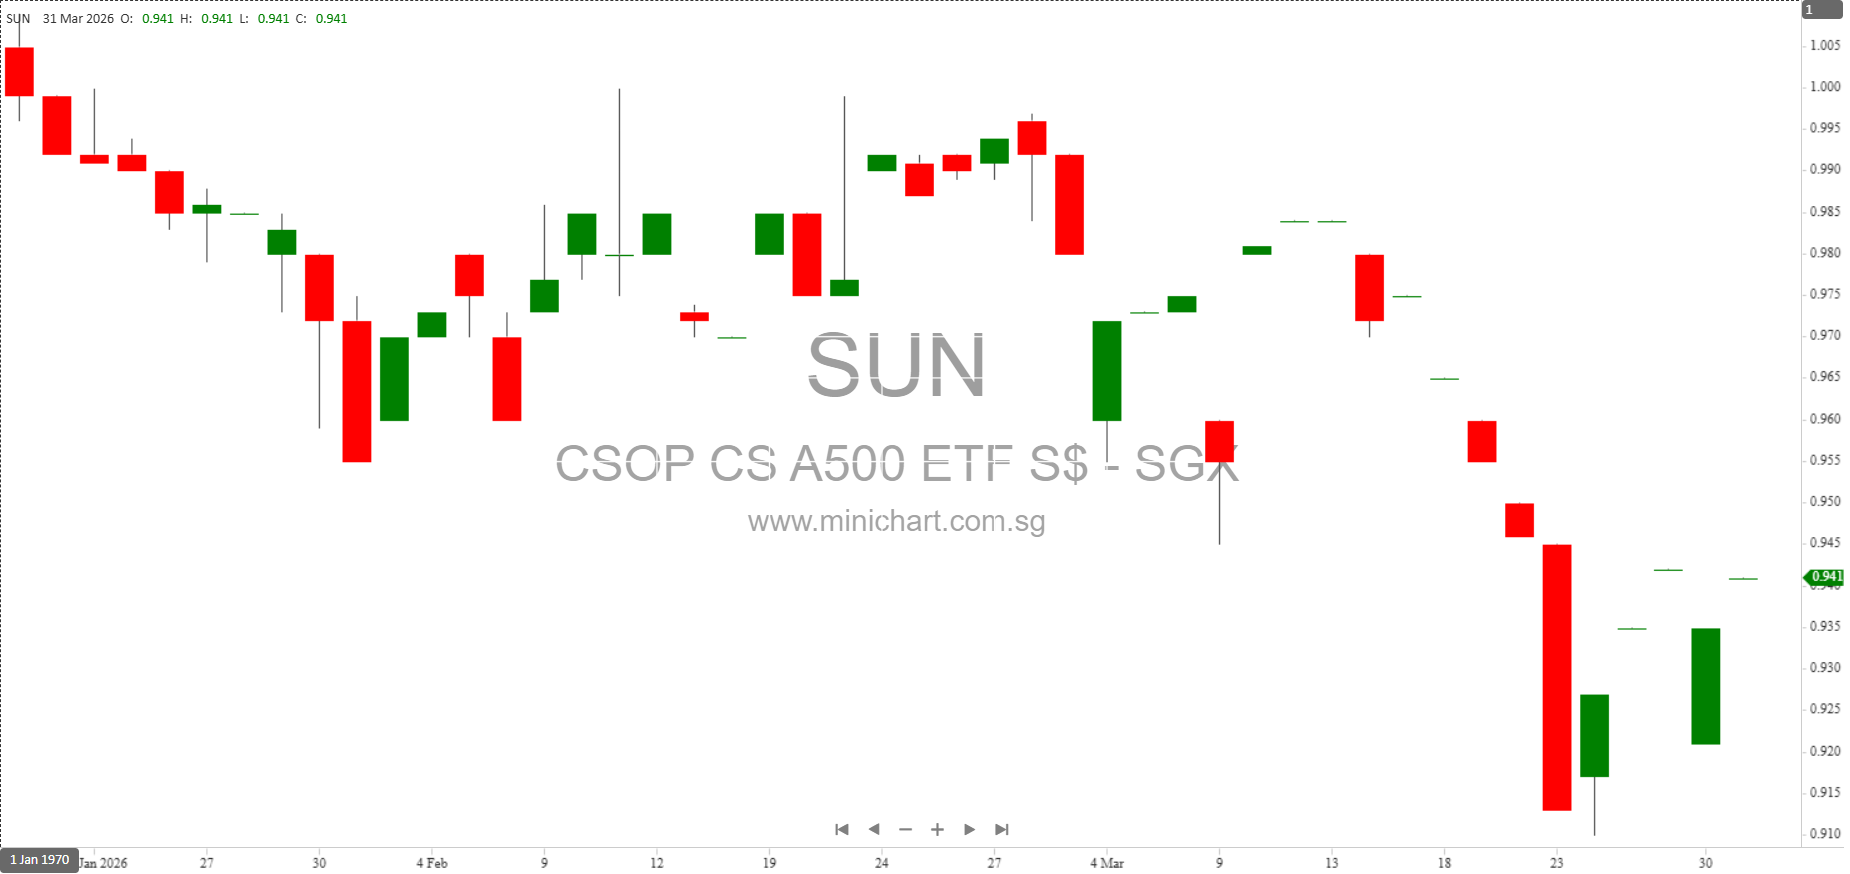
- The CSOP CSAM CSI A500 Index ETF, inactive during 2025, was launched and listed on the SGX on 20 January 2026.
- No mention of IPOs, divestments, or fundraising activities for the year.
Top Holdings and Portfolio Allocation (as at 31 Dec 2025)
| ETF | Top Holdings | % of NAV |
|---|---|---|
| iEdge SEA+ TECH | Wipro Ltd, Infosys Limited, PT Astra International Tbk, Grab Holdings, Sea Limited | Top 5 = 47%+ |
| Huatai-PineBridge SSE Dividend | Huatai-PineBridge SSE Dividend Index ETF (100% feeder) | 100% |
Risk Management and Commentary
- The funds maintain traditional risk controls via portfolio diversification and have no material direct exposure to credit, liquidity, or currency risk beyond market movements.
- Expense ratios remained stable, but cost discipline will be key if redemptions persist.
- No legal, tax, or regulatory events, nor any macroeconomic shocks, were flagged as affecting the funds during FY2025.
Chairman’s Statement
No direct Chairman’s Statement was found in the report. The Manager’s statement and auditor’s opinion were both neutral and factual, with no positive or negative tone regarding future prospects. The Directors and Manager expressed confidence in the funds’ ability to continue as going concerns and highlighted compliance with accounting and regulatory standards.
Conclusion & Investment Recommendations
Overall Performance & Outlook: The CSOP ETFs experienced a challenging year, with significant outflows and a sharp drop in net asset values. Returns lagged benchmarks on the tech ETF and were negative for the Dividend ETF, despite outperforming their respective indices. Cost discipline was stable, and the funds maintained compliance and risk controls. The launch of the CSI A500 ETF in early 2026 may provide new growth, but current momentum is weak.
- If you currently hold these ETFs: Consider your investment horizon and risk tolerance. Given the poor 2025 performance, high redemptions, and underperformance versus benchmarks, investors should review their positions. If you have a long-term view and expect a rebound in Southeast Asia tech or China dividends, holding may be justified. Otherwise, rebalancing or reducing exposure may be prudent if your thesis has changed.
- If you do not currently hold these ETFs: Wait for clearer signs of recovery in fund flows or performance. The weak returns and NAV declines suggest caution is warranted. Monitor for stabilization in redemptions and improved tracking versus benchmarks before initiating new positions.
Disclaimer: This article is for informational purposes only and does not constitute investment advice. Investors should conduct their own due diligence and consult with a licensed financial adviser before making decisions regarding these ETFs.