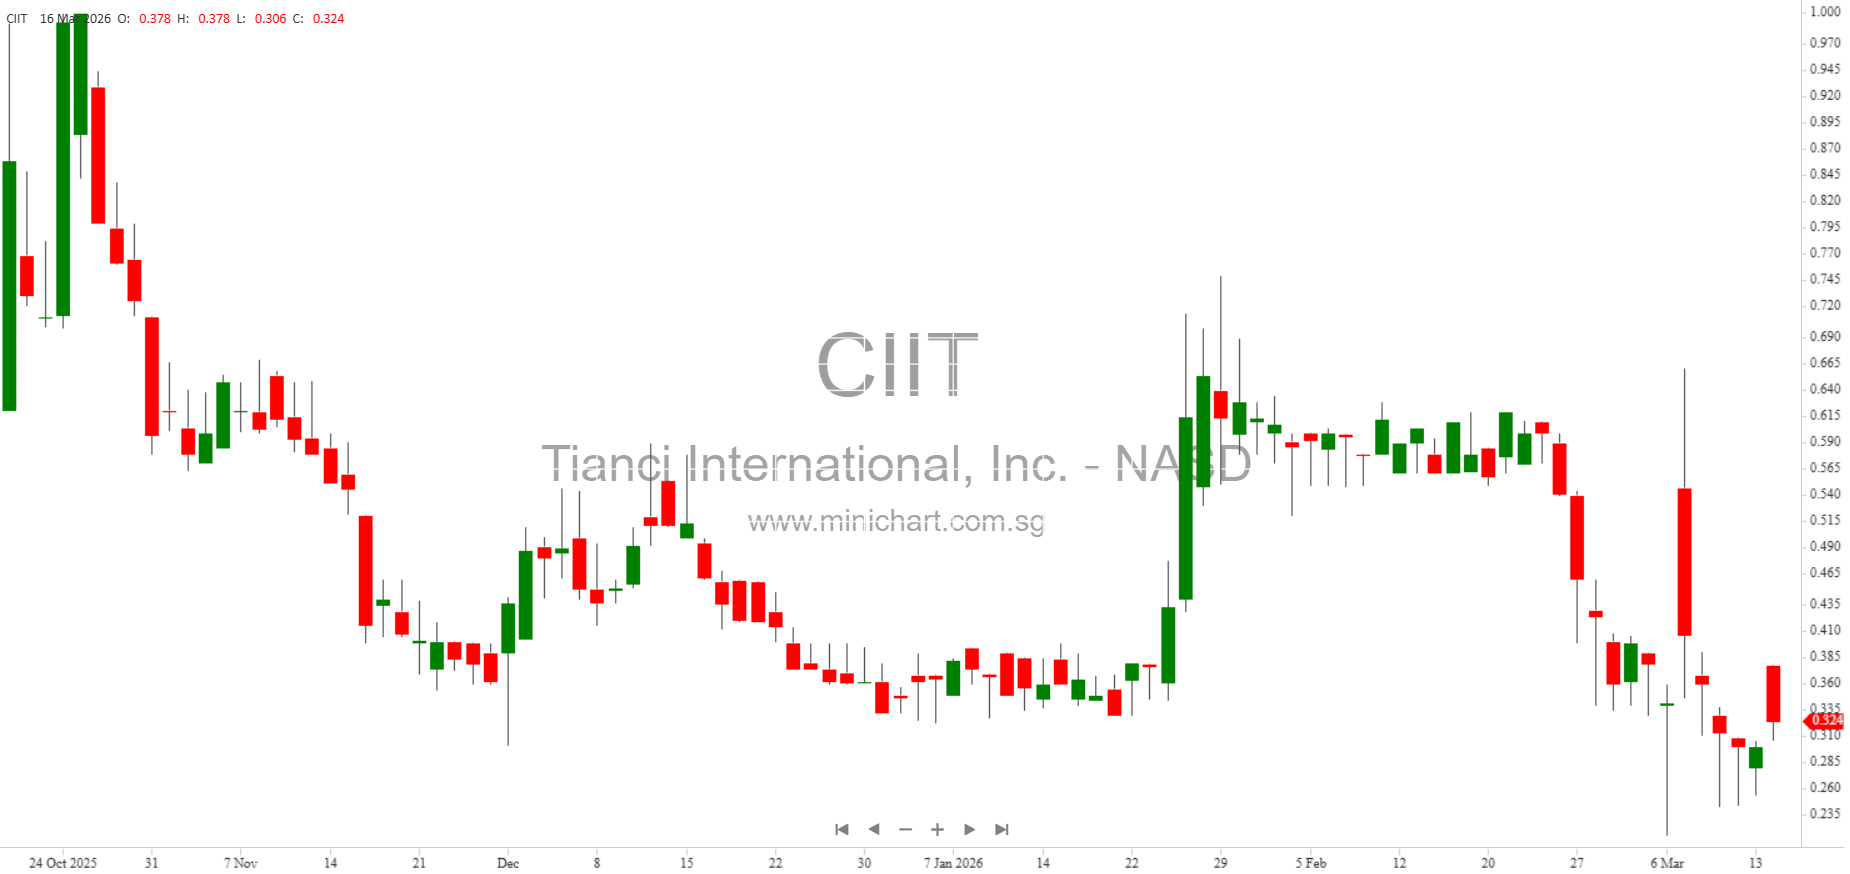
Tianci International, Inc. Reports Q2 Fiscal 2026 Financial Results: Significant Revenue Growth, Strategic Diversification, and Increased Losses
Key Highlights
- Revenue Growth: Total revenue for the quarter ended January 31, 2026 surged by 87% year-over-year, driven by 22% growth in global logistics operations and the Company’s initial foray into the mineral ores market, contributing \$1,315,855 in new revenue.
- Strategic Diversification: The Company made its first sales in the global commodity trade arena, specifically bulk chrome and manganese ore, generating \$1,821,320 in revenue over six months with a remarkable gross profit margin of 120%.
- Profitability Concerns: Despite robust top-line growth, Tianci reported a net loss of \$417,124 for the quarter, marking a 276% increase in quarterly net loss compared to the prior year, mainly due to a 170% rise in general and administrative expenses.
- Margin Compression: Gross profit margin from logistics operations declined slightly from 3.6% to 3.5% quarter-over-quarter, and dropped from 5.0% to 2.5% for the six-month period, as cost of logistics revenue increased by 26% amidst waning demand and rising shipping prices in Southeast Asia.
- Liquidity and Working Capital: Cash reserves fell by \$1.68 million during the six months, leaving a balance of \$723,101. Working capital decreased by \$399,501 to \$2,506,100, primarily due to increased accounts receivable.
- Share Structure Changes: Common shares outstanding increased to 25,331,803 (from 16,531,803), reflecting new issuances. Series B preferred shares decreased from 80,000 to zero. Additional paid-in capital rose to \$6,132,633, while accumulated deficit increased to \$3,530,856.
Detailed Analysis
Revenue Breakdown
Tianci’s logistics services remain the backbone of its revenue, accounting for 65% of total revenue during the quarter. Logistics revenue grew 22% to \$2,531,360 for the quarter, and \$5,747,241 for the six months. The Company’s entry into mineral sales contributed \$1,315,855 for the quarter and \$1,821,320 for the six months, with a standout gross profit margin of 120%, suggesting highly favorable initial terms or pricing in this new business segment.
Other revenues, including electronic parts and business consulting, amounted to \$37,469 for the quarter and \$134,350 for the six months.
Cost and Margin Trends
Cost of revenue from logistics increased by 26% year-over-year, reaching \$2,522,643 for the quarter. The gross profit margin for logistics operations slipped slightly to 3.5%. For mineral sales, the cost was \$1,260,538 for the quarter, resulting in the aforementioned high margin.
Operating expenses soared, with general and administrative expenses rising from \$1,999,225 last year to \$3,794,374 this quarter. Selling and marketing costs also increased to \$45,170. Total operating expenses for the quarter were \$507,434, leading to an operating loss of \$417,124.
Balance Sheet and Liquidity
Cash and equivalents dropped steeply to \$723,101 from \$2,405,352 six months earlier. The main driver was the net loss and a \$561,754 increase in accounts receivable, reflecting either slower customer payments or increased sales on credit.
Inventory more than doubled to \$516,536, likely tied to the new mineral trading business. Total assets declined to \$2,690,261 from \$3,145,971.
Total liabilities remain low at \$101,342, with minimal accounts payable and lease liabilities as the only major obligations. Stockholders’ equity stands at \$2,588,919, down from \$2,986,917.
Share Structure Developments
The Company issued a significant number of new common shares, increasing total outstanding from 16.5 million to 25.3 million. Series B preferred shares dropped to zero, suggesting a conversion or redemption. Additional paid-in capital increased, indicating new equity financing or share-based transactions, including \$288,000 in common stock issued for inventory purchase.
Strategic Outlook
Tianci is actively repositioning itself to focus on high-margin, long-distance shipping lines and reducing reliance on Southeast Asia’s market. The Company’s new mineral trading business, leveraging its logistics infrastructure, offers potential for higher profitability and diversification, though initial administrative costs are high.
Potential Price-Sensitive Information
- Rapid Revenue Expansion: The 87% year-over-year revenue increase, mainly from new mineral trading, is significant and could impact market perception of growth prospects.
- Margin and Loss Trends: The sharp increase in administrative expenses and net losses, despite revenue growth, may concern investors about the Company’s ability to translate top-line growth into profitability.
- Share Issuance: The large jump in common shares outstanding and conversion of preferred shares could affect share value through dilution.
- Liquidity Risks: The substantial drop in cash reserves and increased accounts receivable signal possible liquidity challenges if losses persist or receivables are not collected promptly.
- Strategic Shift: Entry into mineral trading and focus on long-distance shipping mark a major strategic change, potentially increasing volatility and risk, but also offering new growth avenues.
Conclusion
Tianci International, Inc. delivered strong revenue growth in Q2 Fiscal 2026, supported by diversification into mineral trading. However, increased costs and losses, dilution from share issuance, and falling liquidity are key concerns for shareholders. The Company’s strategic pivot towards higher-margin shipping and commodity trading could drive future value, but execution risks and operational expenses need close monitoring.
Disclaimer
This article is for informational purposes only and does not constitute investment advice or a recommendation to buy or sell any securities. All information is based on unaudited financial disclosures and management statements as of January 31, 2026. Investors should review official filings and consult their financial advisors before making investment decisions. Past performance is not indicative of future results.