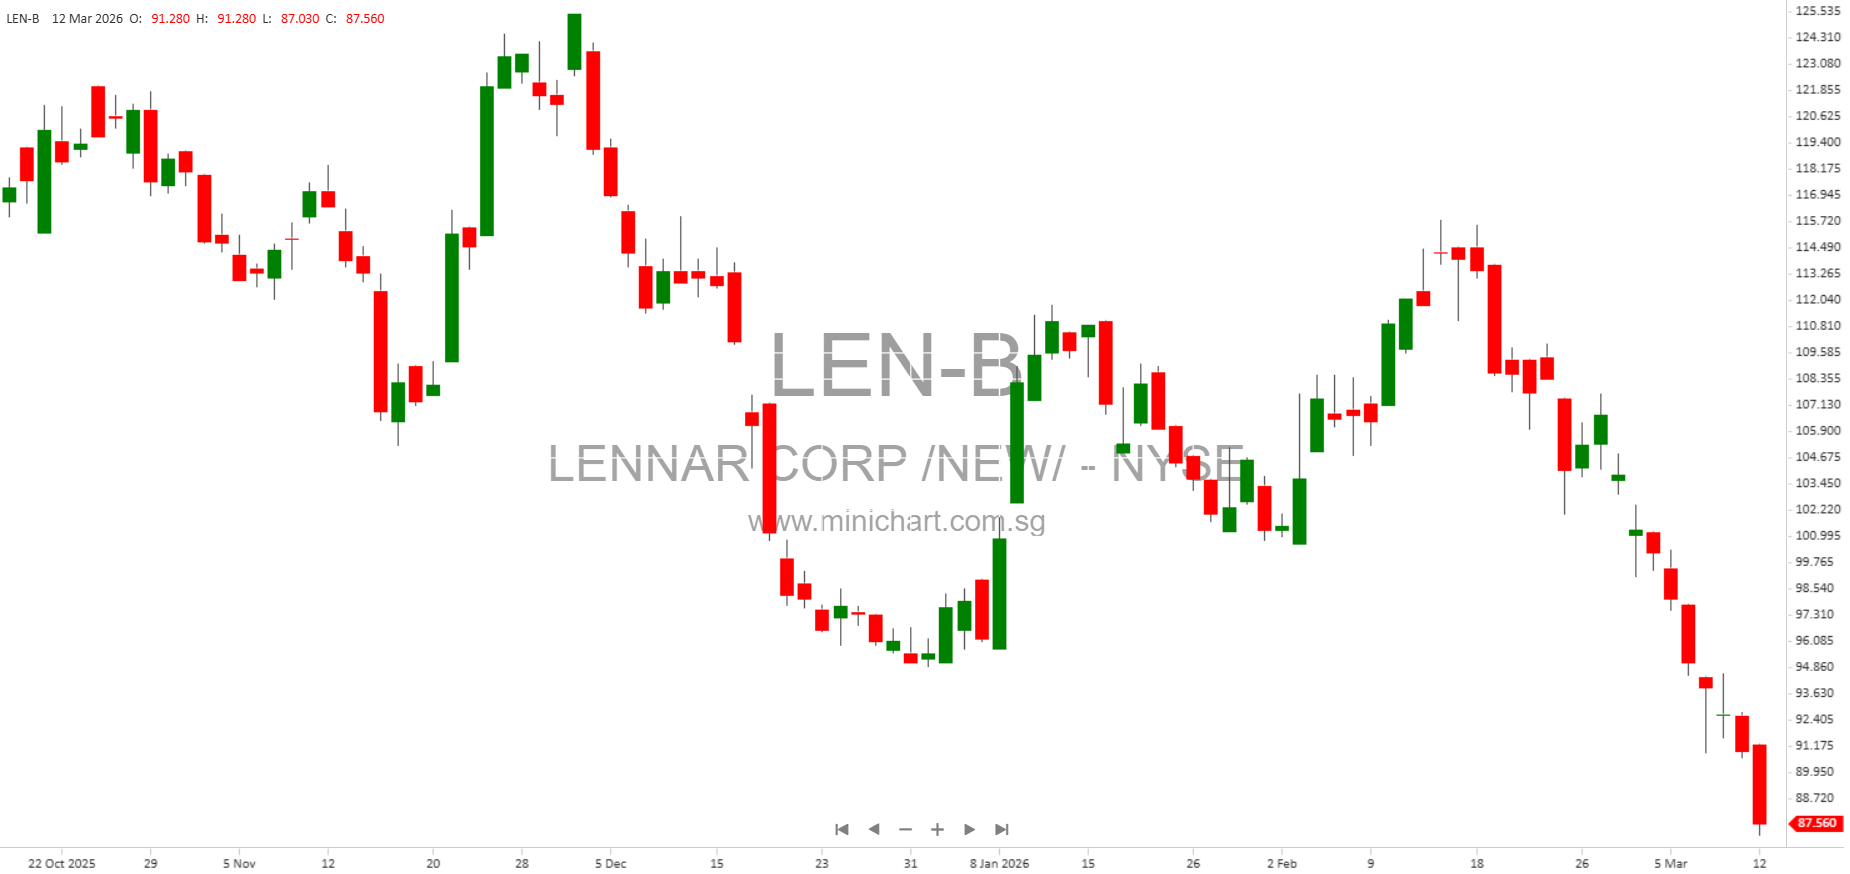
Lennar Corporation Reports Q1 2026 Earnings: Strategic Execution Amid Industry Headwinds
Key Financial Highlights
- Net Earnings: \$229 million, or \$0.93 per diluted share (down from \$520 million, or \$1.96 per diluted share, in Q1 2025).
- Adjusted Net Earnings: \$218 million, or \$0.88 per diluted share, excluding \$15 million in mark-to-market gains on technology investments.
- Total Revenues: \$6.6 billion, down 13% year-over-year from \$7.6 billion.
- New Orders: 18,515 homes (up 1% YoY); Backlog: 15,588 homes valued at \$6.0 billion.
- Deliveries: 16,863 homes (down 5% YoY).
- Average Sales Price: \$374,000 (down from \$408,000 in Q1 2025).
- Gross Margin on Home Sales: 15.2% (down from 18.7% in Q1 2025).
- SG&A Expenses: 9.8% of home sales revenue (up from 8.5%).
- Net Margin on Home Sales: 5.3%.
- Financial Services Operating Earnings: \$91 million (down from \$143 million).
- Multifamily Operating Earnings: \$18 million (up from break-even).
- Lennar Other Operating Loss: \$5 million (improved from \$89 million loss).
- Share Repurchase: 2 million shares for \$237 million at an average price of \$118.54 per share.
- Homebuilding Cash/Cash Equivalents: \$2.1 billion; No borrowings under \$3.1 billion credit facility.
- Homebuilding Debt to Total Capital: 15.7%.
Management Commentary and Strategic Focus
Executive Chairman and CEO Stuart Miller highlighted that Lennar continues to face persistent headwinds, including high mortgage rates, affordability issues, cautious consumer sentiment, and heightened geopolitical uncertainty (notably, the recent conflict in Iran). Despite these challenges, management reaffirmed its commitment to a “production-first” strategy, focusing on maintaining supply, operational efficiency, and cost controls.
Miller emphasized Lennar’s use of incentives (averaging 14% per sale) and strategic price adjustments to sustain sales volumes in a market where affordability remains a key constraint. The company is actively “designing around affordability” rather than waiting for market conditions to improve, prioritizing volume to gain scale and margin advantages.
Notably, Lennar improved its average cycle time to a company-best 122 days and increased inventory turns to 2.5x, reflecting the success of its land-light model and operational improvements. Construction costs dropped over 2.5% in Q1 and have declined 12% over two years, despite labor and material price pressures.
Segment Performance and Operating Details
- Home Sales Revenue: Decreased 13% to \$6.3 billion, driven by lower average sales price (-8%) and lower deliveries (-5%).
- Gross Margins: Declined to \$951 million (15.2%) from \$1.4 billion (18.7%), pressured by lower revenue per square foot and higher land costs, partially offset by construction cost reductions.
- SG&A: Increased as a percentage of revenue due to lower leverage on declining revenues.
- Financial Services: Earnings fell on lower loan lock volume and lower profit per loan.
- Multifamily: Significant improvement to \$18 million operating profit from break-even last year.
- Lennar Other: Loss reduced to \$5 million (from \$89 million), reflecting mark-to-market gains on technology investments.
- Tax Rate: Effective income tax rate improved to 23.1% from 24.6%, aided by a charitable contribution of appreciated stock.
Q2 2026 Guidance (Potentially Price-Sensitive)
- New Orders: 21,000–22,000 homes
- Deliveries: 20,000–21,000 homes
- Average Sales Price: \$370,000–\$375,000
- Gross Margin: 15.5%–16.0%
- SG&A: 8.9%–9.1% of home sales
- Financial Services Operating Earnings: \$100 million–\$110 million
The company expects improved margins and lower SG&A as volumes increase during the spring selling season. This guidance, which anticipates a sequential improvement in both deliveries and profitability measures, is likely to be closely watched by investors and could affect the share price.
Balance Sheet and Capital Return
- Strong Liquidity: \$2.1 billion in homebuilding cash, no outstanding draw on revolving credit facility.
- Conservative Leverage: Homebuilding debt to total capital at 15.7%; net homebuilding debt to total capital at 8.3%.
- Active Share Repurchase: \$237 million spent on buybacks in Q1.
Risks and Forward-Looking Statements
Lennar cautions that its forward-looking statements are subject to a wide range of risks, including real estate market slowdowns, persistent affordability challenges, interest rate volatility, supply chain and labor cost pressures, regulatory changes, potential natural disasters, and other macroeconomic or geopolitical uncertainties. Investors should be aware that actual performance could differ materially from guidance and expectations.
Important Takeaways for Investors
- Significant year-over-year decline in earnings and margins, primarily due to lower home prices, higher land costs, and increased use of incentives.
- Guidance for Q2 points to stabilization and potential margin recovery, but overall market conditions remain challenging.
- Strong liquidity and disciplined capital management provide flexibility to navigate a difficult housing environment.
- Share repurchases demonstrate management’s confidence and may provide downside support to the stock.
- Investors should monitor execution on cost controls, margin recovery, and the company’s ability to maintain volumes in an affordability-constrained market.
- Any shifts in mortgage rates, consumer sentiment, or regulatory developments could have material impacts on Lennar’s results and share price.
Upcoming Events
Lennar will host a conference call to discuss Q1 earnings on March 13, 2026, at 11:00 AM Eastern Time. The call will be webcast live and available for replay through the company’s investor relations site.
Disclaimer: This article is a summary of Lennar Corporation’s Q1 2026 earnings and related disclosures. It is for informational purposes only, does not constitute investment advice, and is not a recommendation to buy or sell any securities. Investors should review official filings and consult their financial advisors before making investment decisions. All forward-looking statements are subject to risks as described in the company’s SEC filings.