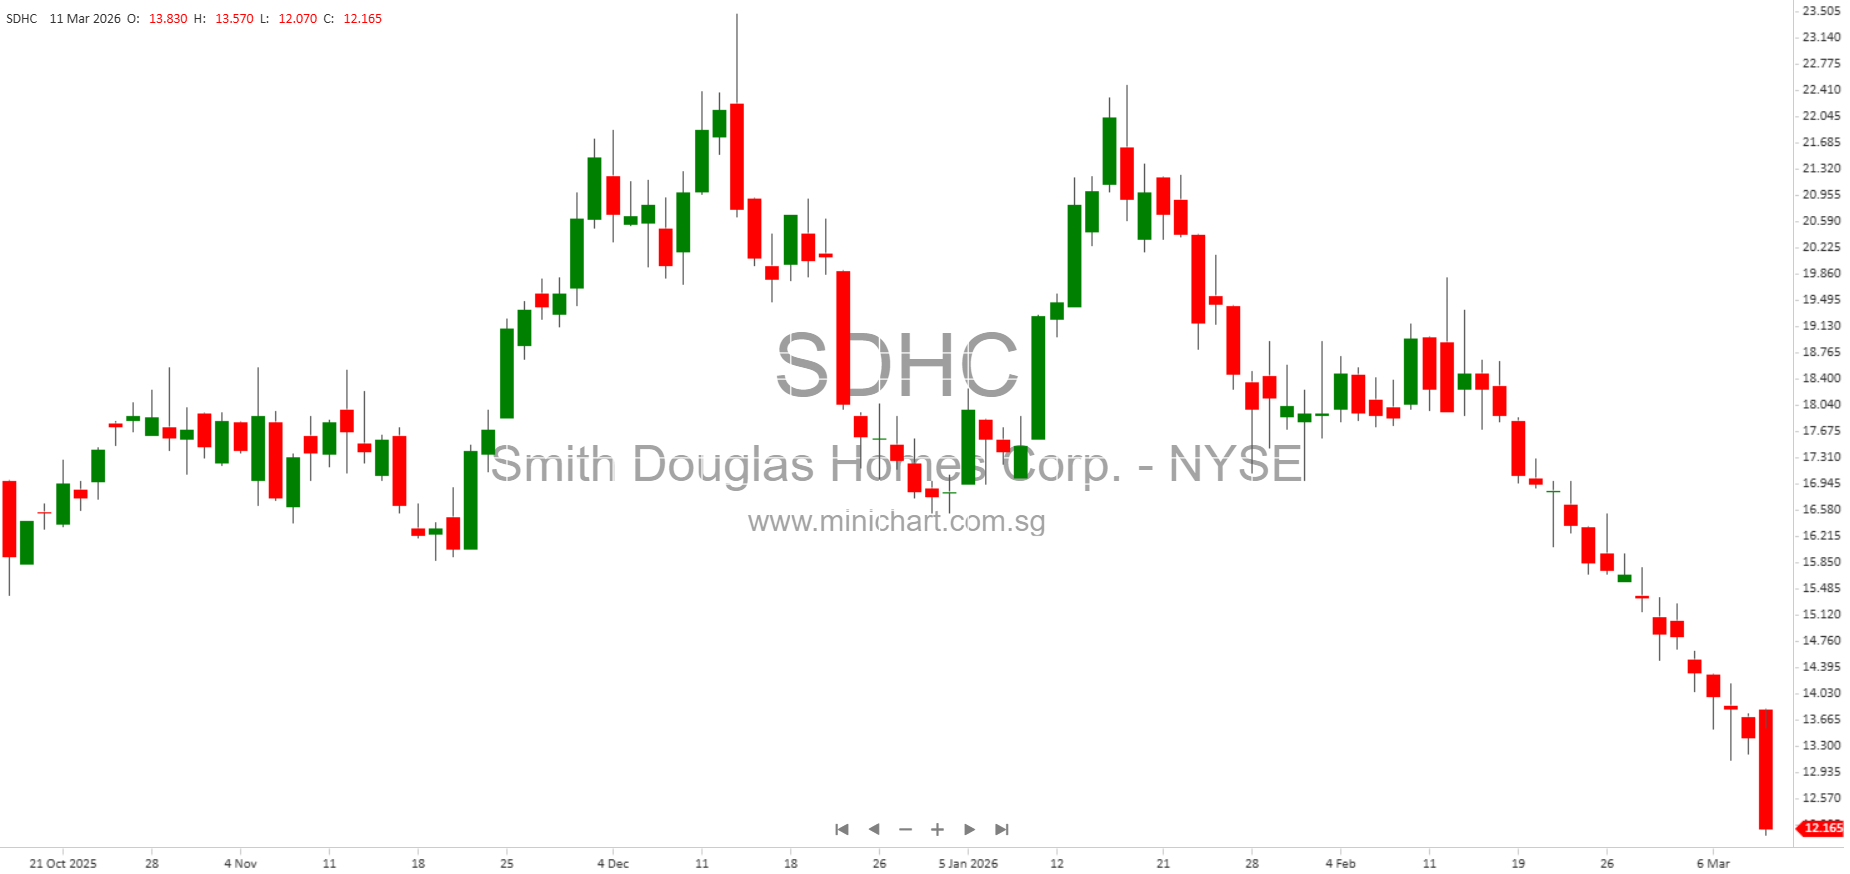
Smith Douglas Homes Corp. Announces Q4 and Full Year 2025 Financial Results
Key Highlights from the Report
- Q4 2025 Performance:
- Net new home orders decreased by 7% to 532 units.
- Pre-tax income fell to \$16.9 million from \$30.0 million in the prior year period.
- Earnings per diluted share were \$0.39.
- Full Year 2025 vs. Full Year 2024:
- Home closings increased 1% to 2,908 units.
- Net new home orders increased 3% to 2,726 units.
- Pre-tax income dropped significantly to \$70.9 million from \$116.9 million.
- Earnings per diluted share were \$1.19.
- Debt-to-book capitalization jumped to 9.0%, up from 0.8% in 2024—a substantial increase in leverage.
- Balance Sheet:
- Cash and cash equivalents at year end stood at \$12.7 million, down from \$22.4 million in 2024.
- Total assets increased to \$557.6 million from \$475.9 million.
- Total equity attributable to Smith Douglas Homes Corp. rose to \$86.7 million from \$73.6 million.
- Non-controlling interests attributable to Smith Douglas Holdings LLC were \$357.4 million.
- Cash Flow:
- Net cash provided by operating activities was \$19.1 million, up from \$2.6 million in 2024.
- Net cash used in investing activities was \$6.6 million.
- Net cash provided by financing activities was \$28.3 million, compared to net cash used of \$11.8 million in 2024.
- Net decrease in cash and cash equivalents was \$9.6 million, compared to an increase of \$2.6 million in 2024.
- Segment Information:
- Southeast segment reported a decrease in home closings and revenue.
- Texas segment saw similar declines.
- Other segments (Atlanta, Houston, Nashville, Alabama Gulf Coast) also included in results.
- Non-GAAP Measures:
- Net debt-to-net book capitalization was 6.6% at year end, reflecting increased leverage.
- Adjusted net income for 2025 was \$12.8 million (tax-effected adjustments applied).
- Conference Call & Webcast:
- Management hosted a conference call on March 11, 2026, at 8:30 a.m. ET to discuss results.
- Dial-in and webcast details were provided for investor access.
- Forward-Looking Statements:
- The report includes forward-looking statements regarding performance, growth, and strategic opportunities.
- Management cautions about risks and uncertainties that could materially affect results.
Important Shareholder Information
- Sharp Decline in Profitability: Both pre-tax income and earnings per share saw significant declines year-over-year. This may be viewed negatively by investors and could impact the share price.
- Increase in Leverage: Debt-to-book capitalization increased markedly from 0.8% to 9.0%. This shift signals a higher leverage profile, which may affect risk perceptions and share valuation.
- Operating Cash Flow Improvement: Despite profitability declines, operating cash flow improved, which could offset some negative sentiment.
- Segment Weakness: The Southeast and Texas segments experienced declines in closings and revenue, indicating potential regional headwinds.
- Non-GAAP Adjusted Net Income: The reported adjusted net income was \$12.8 million, which is materially lower than GAAP net income, indicating the impact of significant adjustments.
- Forward-Looking Risks: The company highlighted risks and uncertainties in the market environment and strategic execution, which could affect future performance.
Detailed Financial Data
| Metric | Q4 2025 | Q4 2024 | FY 2025 | FY 2024 |
|---|---|---|---|---|
| Home Closing Revenue (\$M) | 260.4 | 359 | 804 | 803 |
| Home Closings | 537 | 632 | 2,908 | 2,880 |
| Net New Home Orders | 532 | 573 | 2,726 | 2,651 |
| Pre-tax Income (\$M) | 16.9 | 30.0 | 70.9 | 116.9 |
| Earnings per Diluted Share | 0.39 | 1.81 | 1.19 | 1.81 |
| Debt-to-Book Capitalization | — | 9.0% | 0.8% | |
| Cash & Cash Equivalents (\$M) | — | 12.7 | 22.4 | |
| Operating Cash Flow (\$M) | — | 19.1 | 2.6 | |
| Adjusted Net Income (\$M) | — | 12.8 | 28.8 | |
Potential Share Price Movers
- Profitability Drop: The sharp decline in profitability and earnings per share is likely to be viewed negatively and may exert downward pressure on the share price.
- Increase in Leverage: The considerable increase in debt-to-book capitalization signals a shift in the company’s risk profile, which could concern investors.
- Operating Cash Flow Improvement: The improvement in cash flow may partially offset negative sentiment from the profit decline.
- Segment Weakness: Continued weakness in key geographic segments may raise concerns about growth prospects.
- Forward-Looking Statements and Risks: Management’s caution about risks and uncertainties should be considered by shareholders and potential investors.
Conference Call Details
- Management held a conference call on March 11, 2026, at 8:30 a.m. ET.
- Toll-free dial-in for North America: (+1) 800-715-9871
- International dial-in: (+1) 646-307-1963
- Conference ID: 84593
- Webcast available via the investor relations section of the company website.
Disclaimer
This article is for informational purposes only and does not constitute investment advice or a recommendation to buy or sell any securities. The financial figures contained herein are based on unaudited quarterly and annual reports and may be subject to change. Investors should review the full annual and quarterly filings and consult with their financial advisors before making investment decisions. Forward-looking statements are subject to risks and uncertainties that may cause actual results to differ materially from those projected.