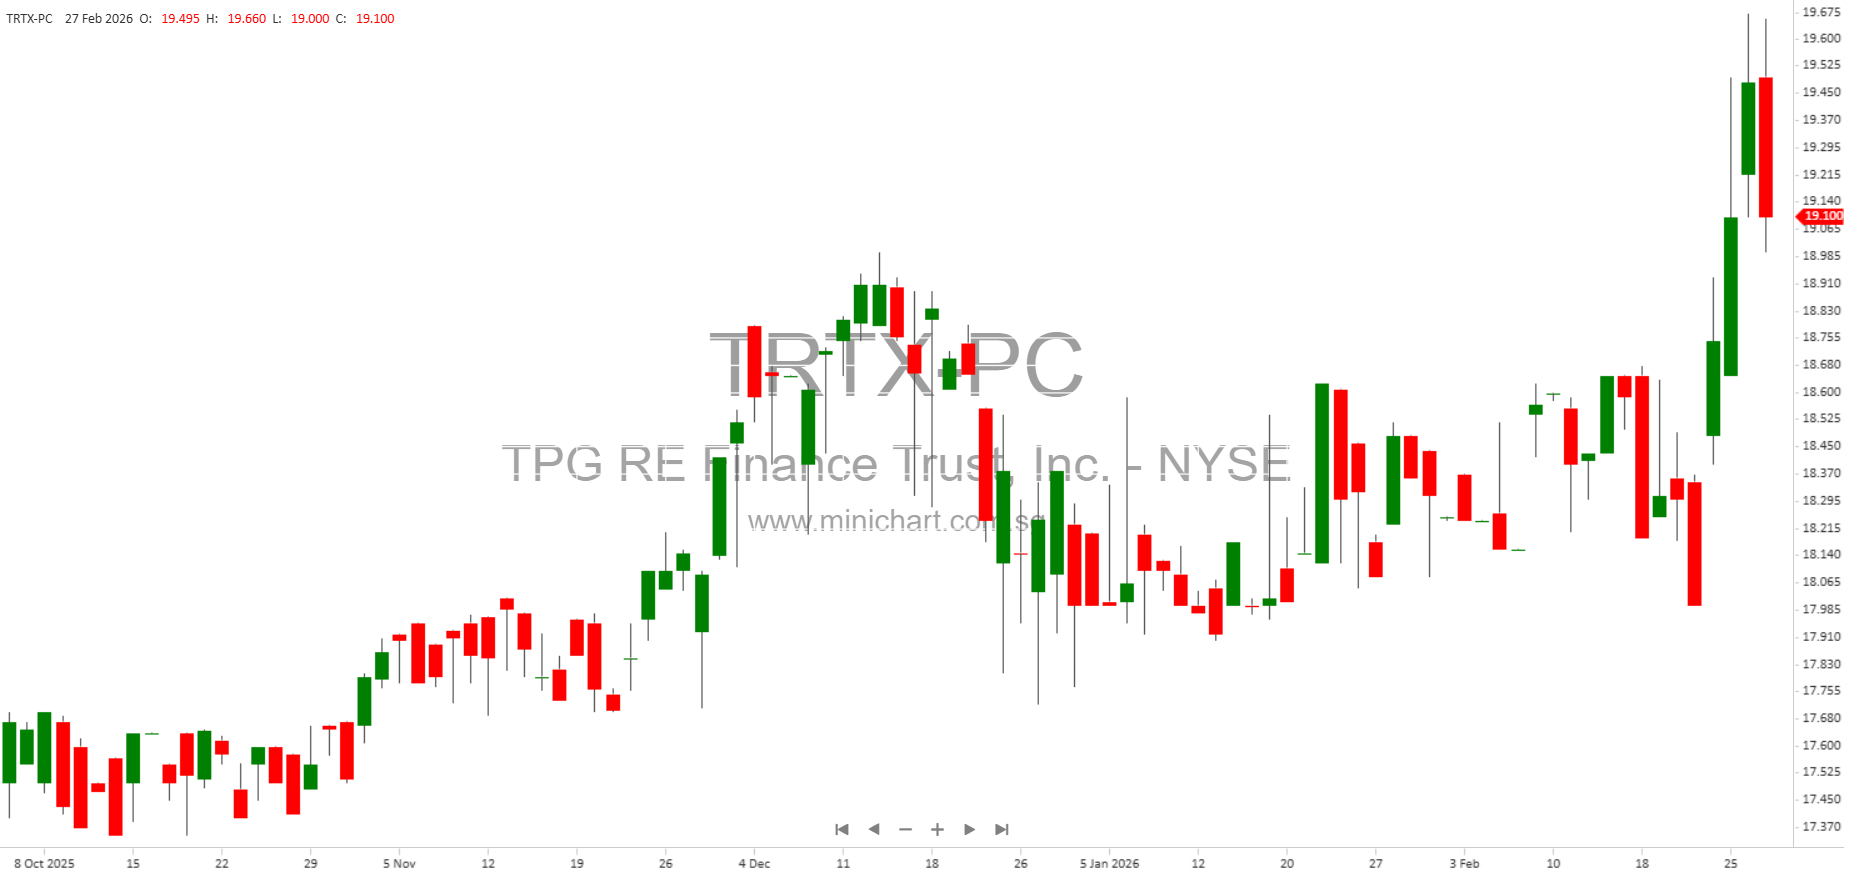
TPG RE Finance Trust, Inc. (NYSE: TRTX) Reports Q4 and Full-Year 2025 Financial Results: Strong Originations, Robust Liquidity, and Strategic Portfolio Shifts
Key Highlights
- Total loan investment portfolio reached \$4.3 billion as of December 31, 2025, with a weighted average all-in yield of 7.15% and a weighted average loan-to-value (LTV) of 65.7%.
- Q4 2025 saw nine first mortgage loan originations totaling \$927 million in commitments, with an initial unpaid principal balance of \$843 million. For the full year 2025, there were 20 first mortgage loans originated with commitments of \$1.9 billion.
- Loan repayments for 2025 totaled \$987.9 million, including \$931.5 million in full repayments across 15 loans and \$56.4 million in partial repayments. In Q4 alone, loan repayments were \$378.3 million, all full repayments across six loans.
- Loan portfolio remains almost entirely performing: 100% of portfolio is performing, with no specifically identified loans on non-accrual and a single loan (less than 1% of outstanding balance) accounted on a cash basis.
- TRTX reported Distributable Earnings of \$18.5 million (\$0.24 per diluted share) for Q4 2025 and \$76.8 million (\$0.97 per diluted share) for the year.
- Common dividends declared were \$0.24 per share in Q4 and \$0.96 per share for 2025, representing an annualized dividend yield of 11.3% based on the February 2026 closing price of \$8.46.
- Book value per share stood at \$11.07 as of December 31, 2025.
- Robust liquidity position: \$143.0 million in liquidity, including \$87.6 million in cash and \$51.4 million undrawn capacity on secured facilities.
- Maintained a strong debt-to-equity ratio of 3.0x (up from 2.14x YoY), with 82% of financing non-mark-to-market.
- Repurchased 3.2 million shares at an average price of \$7.90, totaling \$25.3 million, in 2025.
- Significant shift in portfolio composition: Multifamily exposure up by 3%, office exposure down by 40%, and industrial exposure up by 284% year-over-year.
- Risk profile remains stable: weighted average risk rating of 3.0 across the portfolio, unchanged YoY.
- No material loan losses or defaults reported.
- Credit loss reserve increased to \$77.4 million as of Q4 2025 (180 bps of total commitments), reflecting ongoing prudent risk management.
Detailed Financial Results and Strategic Initiatives
Net Income and Distributable Earnings:
For Q4 2025, net income attributable to common stockholders was \$0.2 million (\$0.00 per diluted share), and for the full year was \$45.5 million (\$0.57 per diluted share). Distributable Earnings, an important non-GAAP performance metric for REITs, were \$18.5 million (\$0.24 per diluted share) for Q4 and \$76.8 million (\$0.97 per share) for 2025. Distributable Earnings are closely watched by investors as they underpin the company’s dividend-paying ability.
Dividend Policy:
TRTX maintained a quarterly common dividend of \$0.24 per share, totaling \$0.96 for the year. This equates to an attractive annualized dividend yield of 11.3% on recent share prices. The dividend yield on book value per share at year-end was 8.7%.
Liquidity and Capitalization:
The company ended 2025 with \$143.0 million of liquidity (\$87.6 million in cash, \$51.4 million in undrawn credit, and \$4.0 million in CLO reinvestment proceeds). Debt-to-equity ratio increased to 3.02x, providing significant room under the 4.25x covenant. Non-mark-to-market financing represented 82% of all debt, insulating TRTX from forced deleveraging during market volatility.
Share Repurchases:
During 2025, TRTX opportunistically repurchased 3.2 million shares, or about 4% of the shares outstanding, at a discount to book value (\$7.90 average price vs. \$11.07 book value). This buyback is both accretive to book value and a signal of management’s confidence in underlying asset values.
Loan Portfolio & Asset Quality:
- Total portfolio: \$4.3 billion in commitments, \$4.1 billion in unpaid principal balance.
- Average loan size: \$85.8 million.
- Portfolio composition (by property type): Office 10.6%, Multifamily 53.4%, Hotel 6.0%, Life Science 7.8%, Mixed-Use 7.8%, Industrial 13.4%, Self-Storage 0.9%.
- Geographic exposure: East 29.9%, West 38.1%, Southeast 14.0%, Southwest 9.7%, Midwest 8.5%.
- Loan risk: Weighted average risk rating of 3.0 (“medium risk”) on a 5-point scale, stable quarter-over-quarter and year-over-year.
- Loan originations in Q4 focused on multifamily and industrial properties, in line with strategic portfolio shifts away from weaker office markets.
- Portfolio is 99.7% floating-rate, benefitting from rising rates and supporting higher NII (net interest income) in a higher rate environment.
- No loans on non-accrual, and only one small loan (less than 1% of balance) on cash accounting basis.
Credit Quality and Reserves:
The current expected credit loss (CECL) reserve increased by \$11.3 million in Q4 to \$77.4 million (180 bps of commitments), reflecting ongoing conservative risk management. Importantly, there are no loans specifically identified as impaired or non-performing.
Financing and Debt Management:
- 82% of the company’s debt is non-mark-to-market, reducing refinancing and margin call risks in volatile markets.
- Weighted average cost of funds: 1.82%.
- Weighted average approved advance rate: 83.8%.
- Debt maturity profile is well-staggered with no near-term refinancing cliffs; significant capacity remains for new originations under existing credit facilities.
- Two new CRE CLOs issued in 2025, totaling \$2.2 billion at attractive terms (average advance rate of 87.3%, issuance rate SOFR + 1.75%).
- Redeemed \$1.1 billion and \$411.5 million of investment grade CLO securities in 2025, further optimizing the capital stack.
Portfolio Migration and Strategic Realignment:
Over the past 12 months, TRTX has rebalanced its portfolio towards higher-growth and resilient asset classes:
- Multifamily exposure increased by 3% to 53.4% of the portfolio, reflecting strong demand fundamentals.
- Office exposure reduced by 40% to 10.6%, a prudent move given sector headwinds.
- Industrial exposure surged by 284% year-over-year, now comprising 13.4% of the portfolio, aligning with the sector’s robust performance.
- Life science and mixed-use exposures were modestly trimmed.
Shareholder and Price Sensitive Considerations:
- The company’s dividend yield remains highly attractive and well-covered by Distributable Earnings, a key metric for REIT investors.
- The share repurchase program, at a significant discount to book, is accretive and may support future share price appreciation.
- Stable risk ratings and a performing loan book position TRTX as a relatively safe haven among commercial mortgage REITs during a period of sector stress.
- Proactive portfolio rebalancing away from office and towards multifamily/industrial may lead to improved asset quality and reduced risk.
- Strong liquidity and low-cost, non-mark-to-market financing provide ample flexibility for opportunistic loan growth and support downside protection.
- Any sustained improvement in real estate capital markets or credit spreads could further enhance earnings and book value.
Potential Share Price Catalysts
- Continued strong dividend coverage and high yield may attract income-focused investors.
- Share buyback at a substantial discount to book value is accretive and could narrow the price-to-book gap.
- Stability in loan risk and lack of defaults/non-accruals may set TRTX apart from peers facing greater credit issues.
- Strategic shift into multifamily and industrial assets may improve portfolio performance and lower risk.
- Robust liquidity and conservative leverage enhance financial flexibility, supporting growth and downside protection.
Outlook and Management Commentary
Management continues to emphasize prudent risk management, capital preservation, and opportunistic loan origination in favored property types. The company remains focused on maintaining high liquidity, leveraging its relationship with TPG for both capital markets access and deal flow, and generating stable, attractive returns for shareholders.
While macroeconomic and market risks remain (interest rates, credit spreads, commercial real estate headwinds, and potential recession concerns), TRTX’s proactive portfolio repositioning and robust balance sheet position it well for continued performance in 2026.