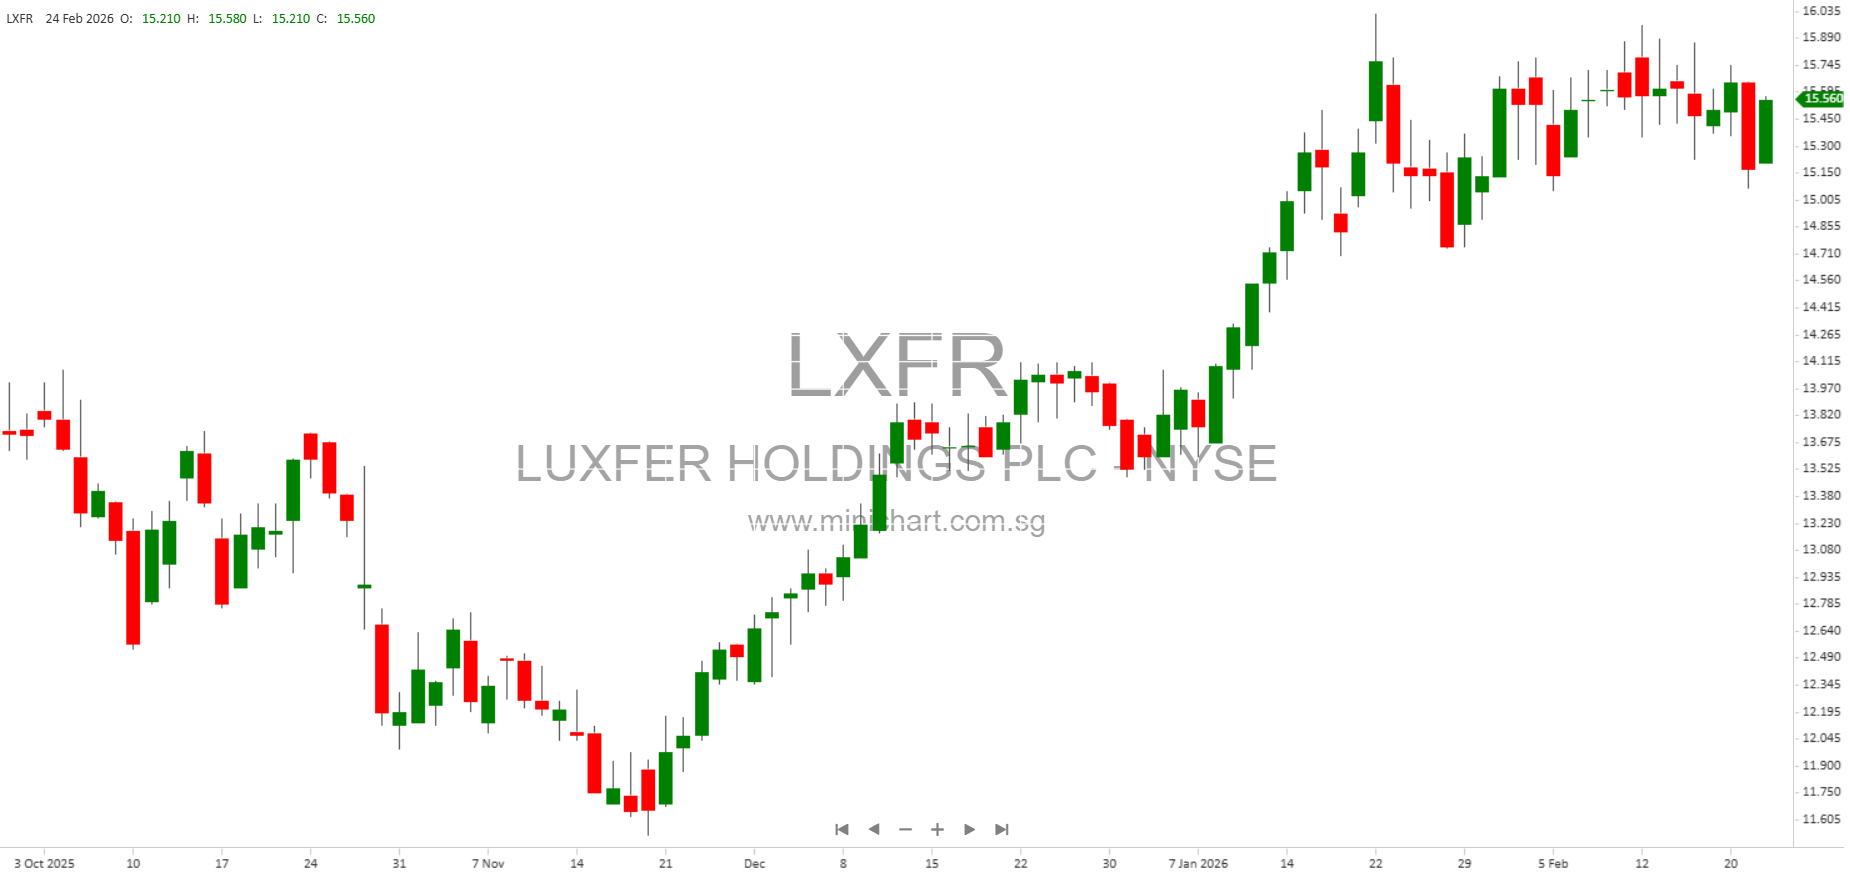
Luxfer Holdings PLC Delivers Robust 2025 Results, Provides 2026 Guidance Amid Strategic Shift
Key Financial and Strategic Highlights for Investors
Strong Performance in 2025 Surpasses Expectations
-
Full-Year 2025 Results:
- Net Sales declined 1.9% to \$384.6 million (from \$391.9M in 2024), but Adjusted Net Sales (excluding divested Graphic Arts business) rose 2.5% to \$371.2 million.
- Net Income was \$13.1 million (\$0.48 per diluted share), down from \$18.3 million (\$0.68 per share) in 2024. However, Adjusted Diluted EPS rose 12.1% to \$1.11 from \$0.99.
- Adjusted EBITDA increased 4.2% to \$51.9 million (from \$49.8M), with Adjusted EBITDA margins resilient at 14.0%.
- Free cash flow was robust at \$26.2 million, enabling a reduction in net debt to \$31.1 million (Net debt/Adjusted EBITDA: 0.6x).
- The company completed the divestiture of the Graphic Arts segment (early July 2025), sharpening its portfolio focus and improving margin quality.
- Dividends of \$13.9 million were distributed and \$3.1 million (246,875 shares) of common stock was repurchased in 2025, reflecting strong capital return to shareholders.
-
Fourth Quarter 2025:
- Net Sales fell 12.3% year-over-year to \$90.7 million (from \$103.4M), mainly due to the absence of Graphic Arts sales; Adjusted Net Sales down 5.5%.
- Net Income was \$0.1 million (\$0.12 per diluted share); Adjusted Diluted EPS of \$0.28 (down modestly from \$0.29).
- Adjusted EBITDA was \$13.0 million (down 5.8%); free cash flow was \$12.6 million (down from \$30.0M in prior year, which included nonrecurring inflows).
Operational and Strategic Developments
-
Operational Excellence Initiatives:
- The company continued to execute previously announced cost-saving and operational excellence initiatives, including the Riverside and Powders Saxonburg centers of excellence, expected to generate ~\$6 million in annual long-term savings.
-
Segment Performance:
-
Elektron Segment:
- FY Net Sales up 11.6% to \$196.4 million; Gross Profit up 13.5% to \$59.0 million; Adjusted EBITDA up 16.0% to \$36.9 million.
- Higher-value defense and aerospace mix drove performance, offsetting some weakness in automotive and military flares demand.
-
Gas Cylinders Segment:
- FY Net Sales down 6.2% to \$174.8 million; Gross Profit down 6.6% to \$28.2 million; Adjusted EBITDA down 16.7% to \$15.0 million.
- Softer demand in SCBA (self-contained breathing apparatus) markets was partially offset by strength in aerospace and specialty industrial.
-
Elektron Segment:
-
Board-Led Strategic Review:
- The Board completed a strategic review in 2024 and continues to evaluate alternatives to enhance long-term shareholder value.
- External functional advisors have been engaged; non-recurring costs related to this are expected to continue into 2026 as adjusted one-time expenses.
2026 Outlook and Guidance
-
Sales Expected to Decline Mid-Single Digits:
- Sales reduction in 2026 reflects temporary timing effects, not a deterioration in underlying demand. These include off-cycle conditions in high-end automotive, the absence of an MRE add-on in defense, and Riverside optimization pull-forwards benefiting 2025 results.
-
2026 Financial Guidance:
- Adjusted Net Sales: \$350M to \$370M
- Adjusted Diluted EPS: \$1.05 to \$1.20
- Adjusted EBITDA: \$50M to \$55M
- Free Cash Flow: \$20M to \$25M
-
Strategic Positioning:
- CEO Andy Butcher emphasized Luxfer’s improved resilience, financial flexibility, and continued commitment to investing in long-term growth, margin expansion, and disciplined execution.
-
Upcoming Shareholder Events:
- Q4 and Full-Year 2025 Earnings Call: February 25, 2026, 8:30 a.m. ET
- 38th Annual Roth Conference: March 24, 2026, Dana Point, CA
Shareholder-Relevant and Potentially Price-Sensitive Items
- Ongoing strategic review and engagement of external advisors could signal potential significant corporate actions (e.g., M&A, divestitures, or other strategic alternatives) that may materially impact shareholder value.
- Completion of the Graphic Arts business divestiture in 2025 demonstrates management’s commitment to portfolio optimization and margin improvement.
- Operational excellence initiatives with an estimated \$6 million in annualized savings may further enhance profitability and cash flows.
- Return of capital to shareholders through share buybacks and dividends continues, reflecting confidence in the Company’s cash generation.
- The 2026 guidance for a mid-single digit sales decline could be interpreted as a temporary headwind but is paired with improved EPS and EBITDA guidance, suggesting underlying operational strength.
- Balance sheet strength: Net debt/Adjusted EBITDA now at 0.6x provides additional flexibility for potential strategic moves and capital returns.
Full Financial Statements and Non-GAAP Metrics
- Full details of the income statement, balance sheet, segment results, and cash flows are available. Adjusted (non-GAAP) metrics are used to reflect ongoing operations and exclude the divested Graphic Arts business and one-time items (e.g., legal recoveries).
- Reconciliations between GAAP and non-GAAP measures are provided; management believes these offer a clearer view of ongoing, underlying performance.
Forward-Looking Statements & Risks
- This release includes forward-looking statements, subject to risks such as market demand, regulatory changes, supply chain disruptions, FX volatility, litigation, M&A execution, and other economic and geopolitical factors. Investors should consult the company’s 10-K and SEC filings for full risk disclosures.
Contact
For further information, contact Kevin Cornelius Grant, Vice President of Investor Relations and Business Development ([email protected]).
Disclaimer: This article is based on Luxfer Holdings PLC’s official SEC filing and earnings press release dated February 24, 2026. The material herein is for informational purposes only and does not constitute investment advice. Investors should perform their own due diligence and refer to official filings and risk factors before making investment decisions. The author and publisher accept no liability for actions taken based on this summary.