Copart, Inc. Reports Q2 2026 Financial Results: Revenue Declines, Net Income Falls, Cash Surges
Key Highlights
- Revenue: \$1.1 billion for the quarter ended January 31, 2026, down 3.6% year-over-year.
- Gross Profit: \$492.8 million, down 6.2% from last year.
- Net Income: \$350.7 million, a 9.5% decrease compared to the same quarter last year.
- Fully Diluted EPS: \$0.36, down 10% from \$0.40 last year.
- Six Months Results: Revenue down 1.4% to \$2.3 billion; gross profit down 0.8% to \$1 billion; net income up 0.7% to \$754.4 million; EPS flat at \$0.77.
- Cash Position: Cash, cash equivalents, and restricted cash surged to \$5.1 billion at January 31, 2026, up from \$2.8 billion at July 31, 2025.
- Conference Call: Webcast scheduled for February 19, 2026, 5:30 p.m. ET.
Detailed Financial Overview
Quarterly Performance
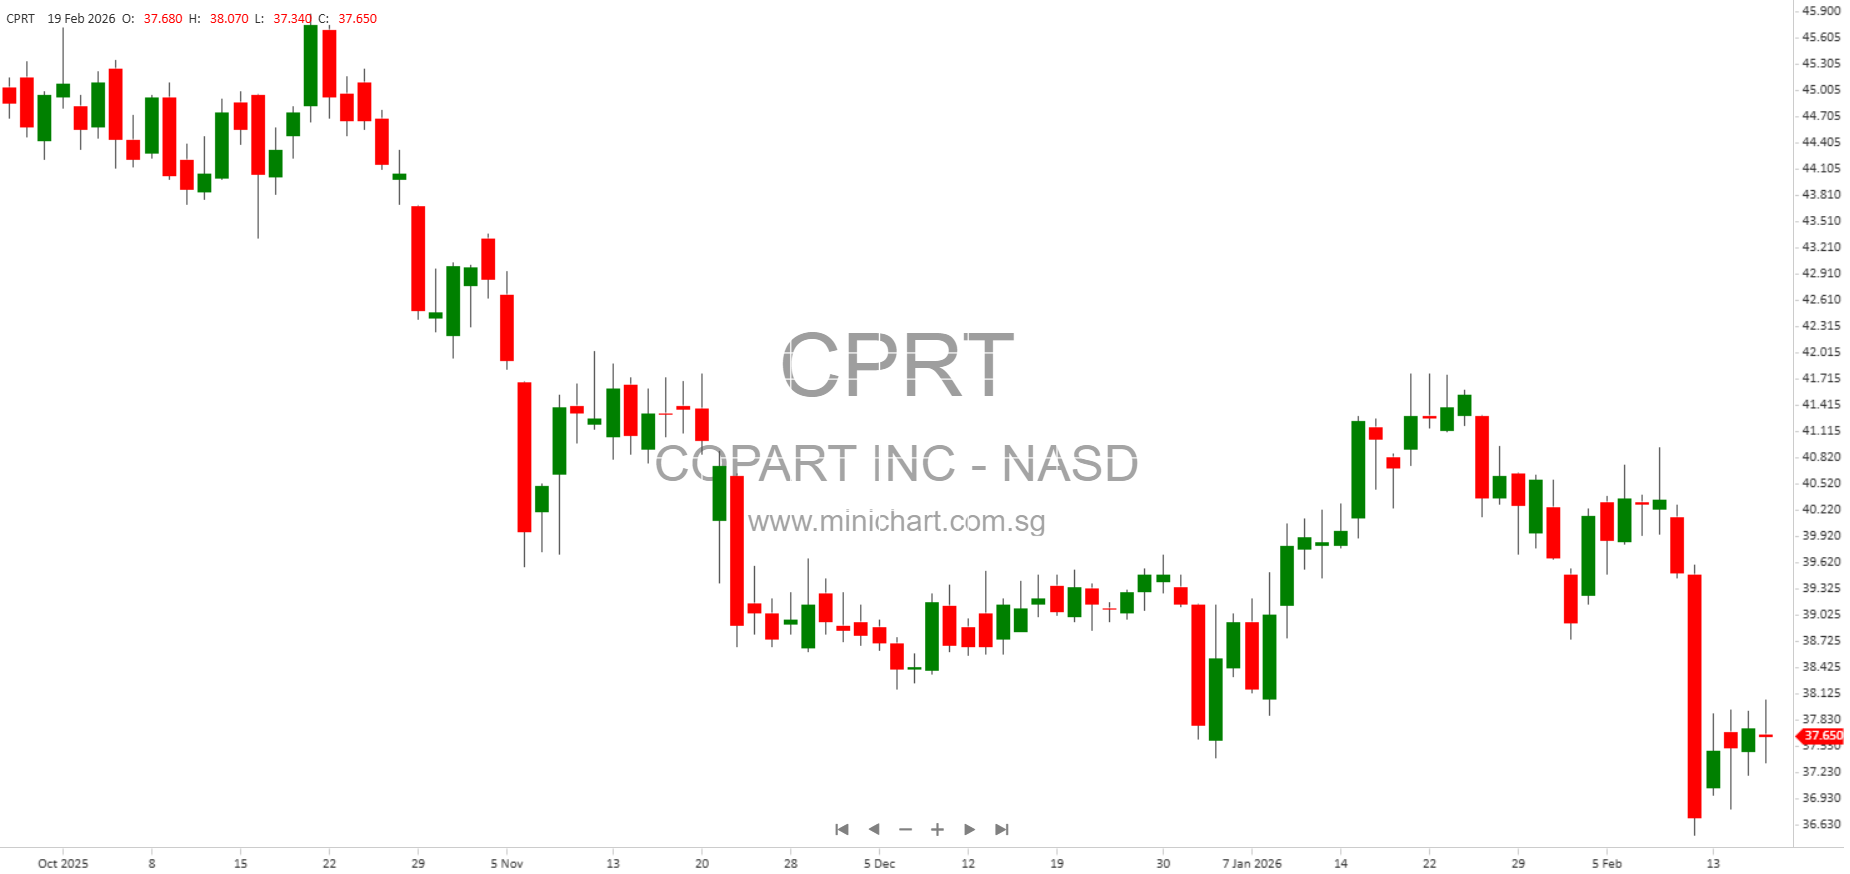
Copart, Inc. (NASDAQ: CPRT) reported a notable decline in its core financial metrics for the quarter ended January 31, 2026:
- Service revenues dropped to \$952.1 million (down 4%) and vehicle sales decreased to \$169.6 million (down 1.4%).
- Total revenue fell to \$1.12 billion, a 3.6% decrease from the prior year.
- Gross profit dropped sharply to \$492.8 million, a 6.2% decline.
- Operating income fell to \$388.7 million, an 8.8% decrease. Net income attributable to Copart, Inc. was \$350.7 million, down 9.5%.
- EPS (fully diluted) for the quarter was \$0.36, down from \$0.40 last year (–10%).
Six-Month Performance
- Revenue for the first half of fiscal 2026 was \$2.28 billion, down 1.4% year-over-year.
- Gross profit was \$1.03 billion, down 0.8%.
- Net income attributable to Copart, Inc. increased slightly to \$754.4 million, up 0.7%.
- EPS was flat at \$0.77.
Balance Sheet and Cash Flow
- Copart’s cash and equivalents soared to \$5.1 billion, more than doubling from \$2.8 billion six months earlier. The increase is driven by the maturity of held-to-maturity securities.
- Accounts receivable rose to \$861.6 million (up from \$762.8 million).
- Total assets reached \$10.6 billion, up from \$10.1 billion.
- Total stockholders’ equity increased to \$9.79 billion from \$9.19 billion.
- Net cash provided by operating activities was \$662.8 million; investing activities added \$1.86 billion mainly due to the maturity of securities, while financing activities used \$205.4 million, driven by \$218.2 million in stock repurchases.
Segment Performance
United States vs International
- US operations contributed \$819.5 million in service revenues and \$102.2 million in vehicle sales for Q2.
- International operations generated \$132.6 million in service revenues and \$67.5 million in vehicle sales.
- Operating income for the US was \$341.5 million, with international at \$47.2 million.
- For the six-month period, US operating income was \$716.4 million, international \$103 million.
Cost and Expense Trends
- Facility operations expenses declined 2.7% for the quarter and 3.6% for the six months.
- Cost of vehicle sales increased 1.8% in the quarter and 2.1% in the six months.
- General and administrative expenses increased 3.2% in the quarter and 2.3% in the six months.
- Stock-based compensation for facilities jumped 31% in the quarter; general and administrative stock-based compensation was up 4.7%, though down 5.3% for the six months.
Other Income and Tax
- Interest income surged 22.7% in the quarter and 19.9% in the six months, reflecting higher cash balances and possibly yield improvements.
- Other income swung positive, adding \$2.35 million versus a loss of \$3.9 million last year.
- Income tax expense rose 19% for the quarter, and 5.6% for the six months, reflecting changes in profitability and possibly tax rates.
Strategic and Operational Updates
- Copart continues to be a global leader in online vehicle auctions, with operations in over 185 countries and more than 4 million units sold in the past year.
- The company operates over 250 locations in 11 countries, serving insurance companies, financial institutions, dealers, rental car companies, fleet operators, and individuals.
- Copart’s technology and platform connect vehicle consignors to approximately 1 million members.
- Stock repurchases of \$218.2 million during the six months may signal confidence in long-term prospects or support for share price.
Potential Share Price Impact
Investors should note:
- The decline in revenue, gross profit, and net income for the quarter may be perceived negatively by the market.
- The flat EPS for the six months, despite lower revenues, suggests cost management and/or other income offsetting operational challenges.
- The dramatic increase in cash position provides operational flexibility and potential for buybacks, acquisitions, or dividends.
- Stock repurchases are typically viewed positively and may support the share price.
- Higher interest income and positive swing in other income could be a tailwind for future quarters.
- Any continued weakness in revenue or profit could put downward pressure on the stock, while strong cash flow and buybacks may offset some concerns.
- Shareholders should monitor upcoming conference calls and future SEC filings for updates on business strategy, risks, and outlook.
Forward-Looking Statements
This report contains forward-looking statements subject to various risks and uncertainties. Actual results may differ materially due to factors including market conditions, operational challenges, and global economic trends. Investors are encouraged to review Copart’s most recent SEC filings for further risk disclosures.
Disclaimer
This article is for informational purposes only and does not constitute investment advice or a recommendation to buy or sell Copart, Inc. securities. Please consult your financial advisor before making any investment decisions.