Prime US REIT FY2025 Financial Results: Recovery Gaining Momentum
Prime US REIT (“PRIME”) has released its FY2025 and 4Q2025 results, demonstrating significant improvements in portfolio fundamentals, leasing activity, and financial stability. The report highlights a rebound in the U.S. office market, successful capital management, and increased distribution payouts, positioning PRIME for a more optimistic outlook going into 2026.
Key Financial Metrics and Performance Summary
| Metric | FY2025 | FY2024 | YoY Change |
|---|---|---|---|
| Portfolio Valuation | US\$1.40 bn | US\$1.35 bn | +3.5% |
| Occupancy | 82.7% | 78.9% (lowest) | +3.8ppt |
| Leasing Volume (sf, % of NLA) | 680k (16%) | 592k (14%) | +15% |
| Rental Reversion | +5.6% | +1.8% | +3.8ppt |
| Distribution per Unit (DPU, US cents) | 0.61 | 0.29 | +110% |
| Distribution Payout Ratio | 65% | 10% | +55ppt |
| Aggregate Leverage | 45.0% | Not disclosed | N/A |
| NAV per Unit (US\$) | 0.53 | Not disclosed | N/A |
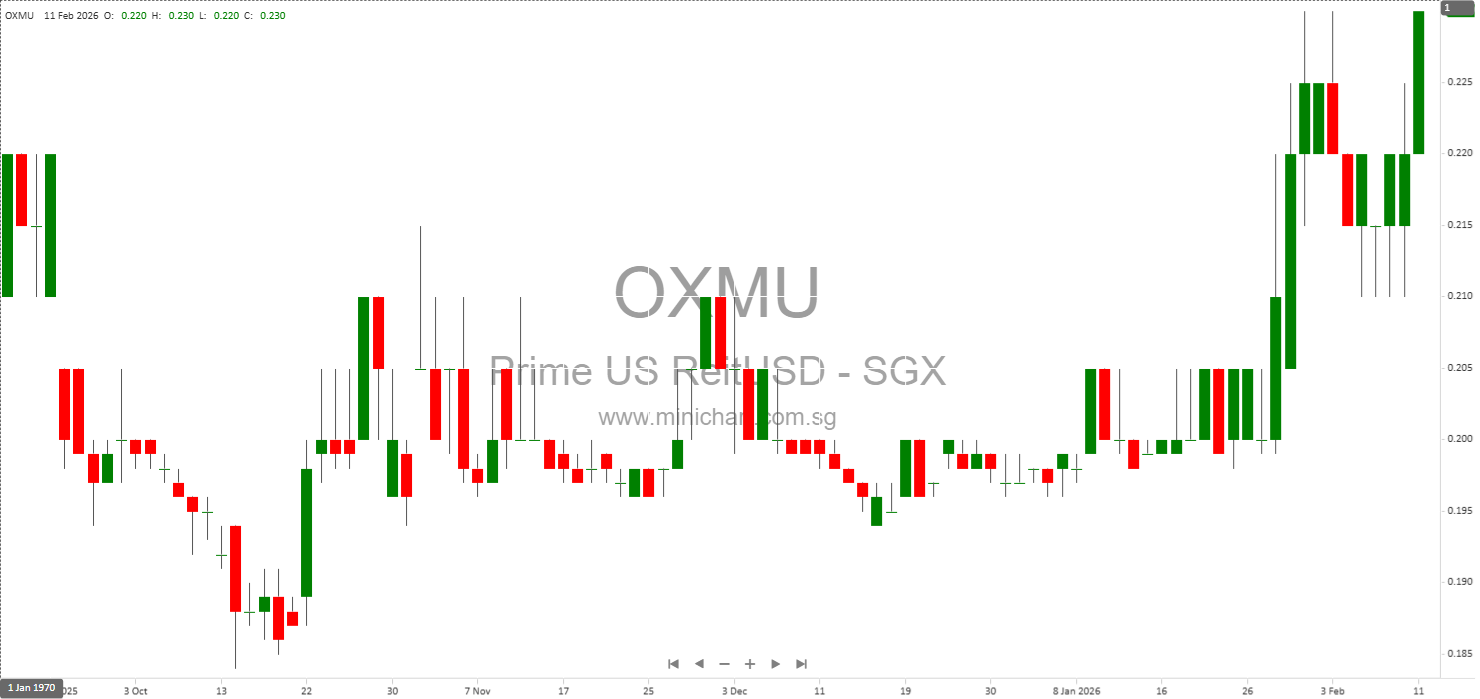
| Unit Price (31 Dec 2025, US\$) | 0.197 | Not disclosed | N/A |
| Discount to NAV | 63% | N/A | N/A |
Dividend and Distribution Comparison
| Period | Distribution per Unit (US cents) | Distribution Payout Ratio |
|---|---|---|
| 2H2025 | 0.49 | 65% |
| 2H2024 | 0.11 | Not disclosed |
Historical Performance Trends
- Occupancy rates have rebounded from a low of 78.9% at the end of 2024 to 82.7% by end-2025, reflecting improved leasing momentum and the effects of proactive asset management.
- Net property income and distributable income have recovered in 2H2025 after a period of retention and lower payouts, partly due to capital invested in securing new leases and asset enhancements.
- Portfolio valuation increased 3.5% YoY, driven by broad-based valuation gains across most assets due to improved contracted cash flows.
Asset Revaluations and Notable Movements
- Significant valuation gains were seen at:
- Waterfront at Washingtonian (+29.2% YoY)
- Reston Square (+23.5% YoY)
- Tower 909 (+20.4% YoY)
- Village Center Station II (+14.7% YoY)
- Significant decline at Tower I at Emeryville (-48.7% YoY), due to higher cap and discount rates following a nearby distressed sale; management believes this to be a cyclical low rather than a permanent impairment.
- 171 17th Street saw a moderate decline of -6.0% YoY, also due to cap/discount rate increases following a comparable sale by a distressed seller.
Fundraising and Capital Management
- US\$25m equity fund raise in October 2025 to fund leasing capex and TI, supporting improved cashflow visibility and enabling the higher payout ratio.
- Aggregate leverage stands at 45.0% with US\$144m debt headroom and US\$65m in committed undrawn facilities, providing ample liquidity to pursue large-scale tenant prospects.
Macroeconomic and Market Environment
- The U.S. economy grew 4.4% in 3Q2025, with unemployment at 4.4% and inflation at 2.7% as of December 2025.
- The U.S. office market saw a 5.2% YoY growth in leasing activity, a 35% YoY increase in investment sales, and two consecutive quarters of positive net absorption, signaling the early stages of an expansionary cycle.
- Flight to quality continues, with leasing concentrated in highly-amenitized, Class A buildings in vibrant markets.
Distribution Payment Details
- 0.25 US cents per unit will be paid for the period 6 Oct 2025 to 31 Dec 2025, with an ex-date of 20 Feb 2026 and payment date of 31 Mar 2026.
- 0.24 US cents per unit was paid on 14 Nov 2025 for the period 1 Jul to 5 Oct 2025.
Outlook and Management Commentary
- Portfolio occupancy is expected to increase further with proactive leasing strategies and ongoing asset enhancements.
- Committed cashflows from new leases underpin the normalization of distribution payout ratios and support improved unitholder returns.
- While some assets remain affected by higher cap rates due to market-specific distressed transactions, management expects sentiment to improve as core market momentum returns.
Conclusion & Investment Recommendations
Overall Assessment: PRIME’s FY2025 results indicate a strong recovery, with portfolio fundamentals, leasing activity, and distribution payouts all showing marked improvement. The REIT’s financial position has been strengthened by disciplined capital management and a successful equity raise, while a significant discount to NAV (63%) persists.
- If you currently hold PRIME US REIT: The improved fundamentals, higher payout ratio, and visible recovery in the U.S. office market support a hold recommendation. Investors may consider holding for further upside as occupancy and distributions normalize, but should monitor asset-specific risks and market volatility.
- If you do not currently hold PRIME US REIT: The substantial discount to NAV and signs of portfolio recovery may present an attractive entry point for medium to long-term investors comfortable with U.S. office market risks. Consider initiating a position, but remain mindful of continued sector headwinds and asset-specific challenges.
Disclaimer: This analysis is based solely on disclosed financial results and company statements. It does not constitute investment advice. Investors should consider their own risk tolerance and consult with a licensed financial advisor before making investment decisions.