Date of Report: October 8, 2024
Broker Name: CGS International Securities
Company Overview
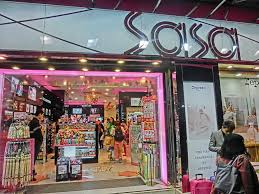
Sa Sa International Holdings Ltd (HKG: 178) is a leading beauty product retailing group in Asia. The company operates one-stop cosmetics stores offering a wide range of products, including skincare, fragrances, make-up, hair, and body care items. Additionally, they provide health and beauty supplements. Sa Sa is also well-known for offering a convenient shopping experience through its multiple online platforms.
Recent Performance
On October 8, 2024, Sa Sa International Holdings Ltd exhibited a strong bullish breakout, signaling a potential trend reversal. After hitting a low point at HK$0.64, the stock rebounded with significant volume, indicating renewed bullish sentiment.
Technical Analysis and Key Metrics
According to the technical analysis:
- Entry Prices: HK$0.93, HK$0.82, HK$0.68
- Support Levels:
- Support 1: HK$0.83
- Support 2: HK$0.62
- Stop Loss: HK$0.59
- Resistance Levels:
- Resistance 1: HK$1.08
- Resistance 2: HK$1.21
- Target Prices:
- Target 1: HK$1.10
- Target 2: HK$1.16
- Target 3: HK$1.24
- Target 4: HK$2.10
Bullish Indicators
Several technical indicators suggest a potential bullish reversal:
- Breakout from Downtrend: Sa Sa has broken out of a downtrend line formed since January 26, 2023. This breakout was accompanied by a strong bullish candle, suggesting the beginning of a positive reversal.
- Range Breakout: The stock has successfully broken out of a trading range between HK$0.62 and HK$0.83, further confirming the bullish sentiment.
- Ichimoku Indicators: Prices are trending above all Ichimoku indicators, supporting the positive outlook.
- MACD: The MACD histogram is positive, and the MACD/signal line has been rising since a crossover at the bottom, indicating upward momentum.
- Stochastic Oscillator: The Stochastic Oscillator has confirmed an oversold crossover, another bullish signal.
- Rate of Change (ROC): The 23-period ROC is rising and has crossed back above the zero line, indicating strength in the trend.
- Directional Movement Index (DMI): The DMI is showing a strong bullish signal.
- Volume Spike: A significant increase in volume during the breakout further supports the likelihood of a bullish reversal.
Analyst’s Commentary
The report by CGS International Securities suggests that despite the recent stop-loss trigger at HK$0.64, Sa Sa International Holdings Ltd is showing renewed upside potential. The bullish breakout, combined with positive technical indicators and a strong volume, reinforces the outlook for a continued upward trend.
This information provides a detailed analysis of Sa Sa International Holdings Ltd based on the October 8, 2024 report by CGS International Securities.