AEM Holdings Ltd. 1H2025 Financial Results Analysis
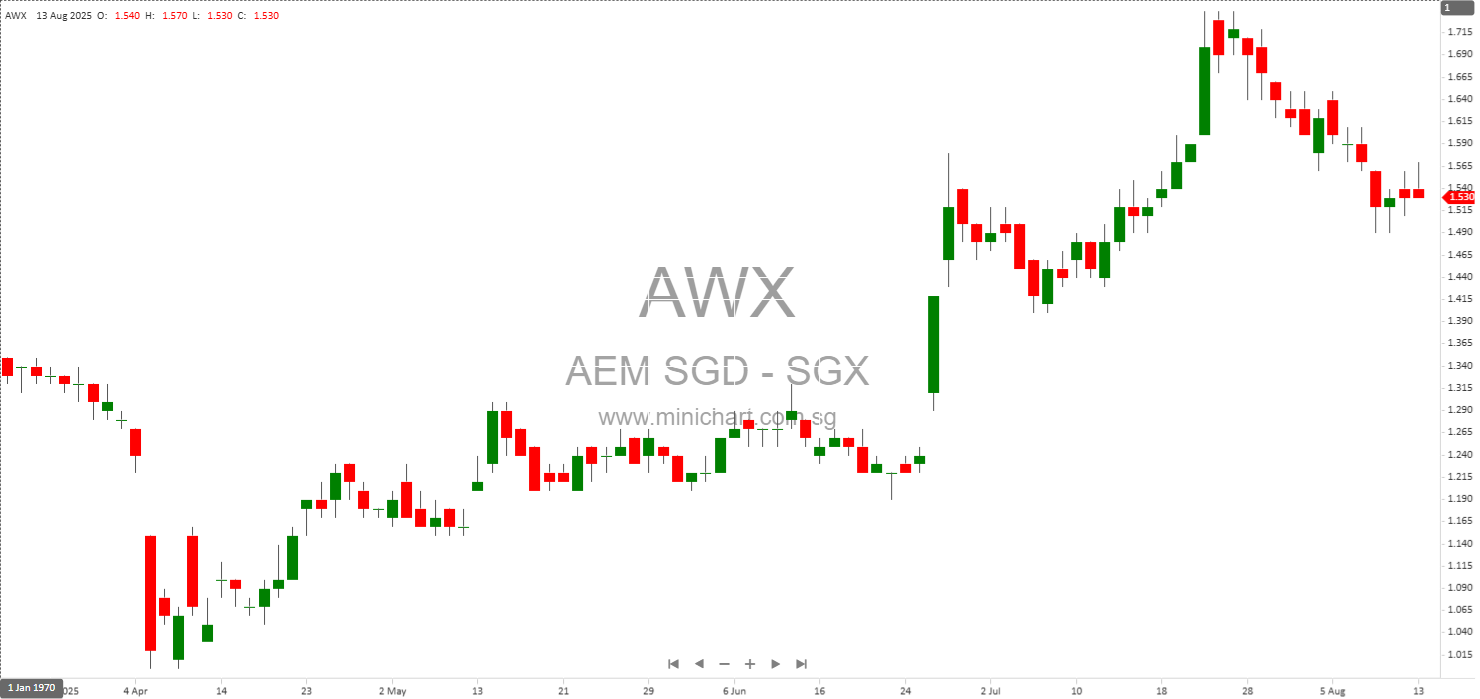
AEM Holdings Ltd. (“AEM”), a global leader in application-specific test and handling solutions for semiconductor and electronics companies, has released its 1H2025 results. The company serves the Compute and Advanced Packaging markets and is listed on the Singapore Stock Exchange (SGX: AWX.SI).
Key Financial Metrics and Performance Overview
| Metric | 1H2025 | 2H2024 | 1H2024 | YoY Change | HoH Change |
|---|---|---|---|---|---|
| Revenue (S\$M) | 190.3 | N/A | 173.6 | +10% | N/A |
| Gross Profit (S\$M) | 48.3 | N/A | 43.5 | +11% | N/A |
| Gross Profit Margin | 25.4% | N/A | 25.0% | +0.4pts | N/A |
| Profit Before Tax (S\$M) | 3.9 | N/A | 1.0 | +284% | N/A |
| PBT Margin | 2.1% | N/A | 0.6% | +1.5pts | N/A |
| Operating Cash Flow (S\$M) | 46.4 | N/A | 7.1 | +556% | N/A |
| Net Asset Value per Share (SG cents) | 152 | 155 | N/A | -1.9% | -1.9% |
| Debt/Equity | 0.2x | 0.2x | N/A | No Change | No Change |
Revenue Mix and Segment Performance
AEM’s revenue for 1H2025 reached S\$190.3 million, a 10% increase compared to 1H2024. The growth was driven primarily by Test Cell Solutions (TCS), which contributed S\$118.6 million, accounting for 62% of total revenue. Instrumentation and contract manufacturing contributed S\$4.6 million (2%) and S\$67.0 million (35%) respectively. The company’s revenue mix continues to favour higher-value TCS offerings, reflecting ongoing adoption and customer engagement in AI/HPC and memory sectors.
Balance Sheet and Financial Position
- Cash position: S\$59.8 million as at June 2025 (up from S\$43.8 million at Dec 2024)
- Inventories: S\$245.4 million (down from S\$296.8 million), mainly due to customer pull-in
- Financial liabilities: S\$72.9 million (down from S\$94.4 million), reflecting debt repayment
- Net assets: S\$483.0 million (down from S\$492.3 million), primarily due to foreign exchange losses on USD-denominated assets
- Net Asset Value per share: 152 SG cents (down from 155 SG cents)
- Debt/Equity: 0.2x (unchanged)
Exceptional Items and Key Risks
- Foreign Exchange Loss: The period saw a foreign exchange loss of S\$5.9 million, impacting net assets and NAV per share.
- No mention of dividends, director remuneration, or share buybacks.
Business and Market Trends
- Industry Dynamics: The semiconductor industry faces a complex environment, but AEM highlights increasing demand for advanced packaging test solutions, especially in thermal and automation areas.
- Customer Engagement: The company reports deepening engagements with AI, high-performance computing (HPC), and memory customers. Notably, its AMPS-BI platform is gaining traction for high-power, high-throughput burn-in of AI/HPC devices.
Outlook and Guidance
Management’s second-half (2H2025) revenue guidance is S\$170 million to S\$190 million, in line with 1H2025 performance. Guidance is tempered by foreign exchange volatility and the timing of orders, particularly in late Q4. However, AEM emphasises that key product milestones are laying a stronger foundation for 2026 and beyond.
Strategic Priorities
- Operational excellence
- Diversifying revenue streams
- Strengthening partnerships
Conclusion and Investment Recommendation
Overall Assessment: AEM’s 1H2025 results show clear operational improvement, with revenue, gross profit, and operating cash flow all increasing significantly year-over-year. The company remains profitable with a robust balance sheet and low gearing. However, net asset value per share declined due to foreign exchange losses, and revenue guidance remains flat given macroeconomic uncertainties and order timing.
- For Existing Shareholders: The company’s strong operational cash flow and strategic positioning in growing semiconductor segments support a hold recommendation. Investors should monitor FX volatility and the realisation of product milestones into 2026.
- For Prospective Investors: While the business fundamentals are solid and AEM is well placed for secular growth trends in AI/HPC, the lack of upward momentum in near-term guidance suggests a wait-and-see approach. Consider entry on further clarity regarding order flow or improvement in macro conditions.
Disclaimer: This analysis is strictly based on the information disclosed in AEM’s 1H2025 results briefing. It does not constitute financial advice. Investors should conduct their own due diligence or consult with a professional advisor before making investment decisions.