DBS Group Holdings Ltd – 1H25 & 2Q25 Financial Results Analysis
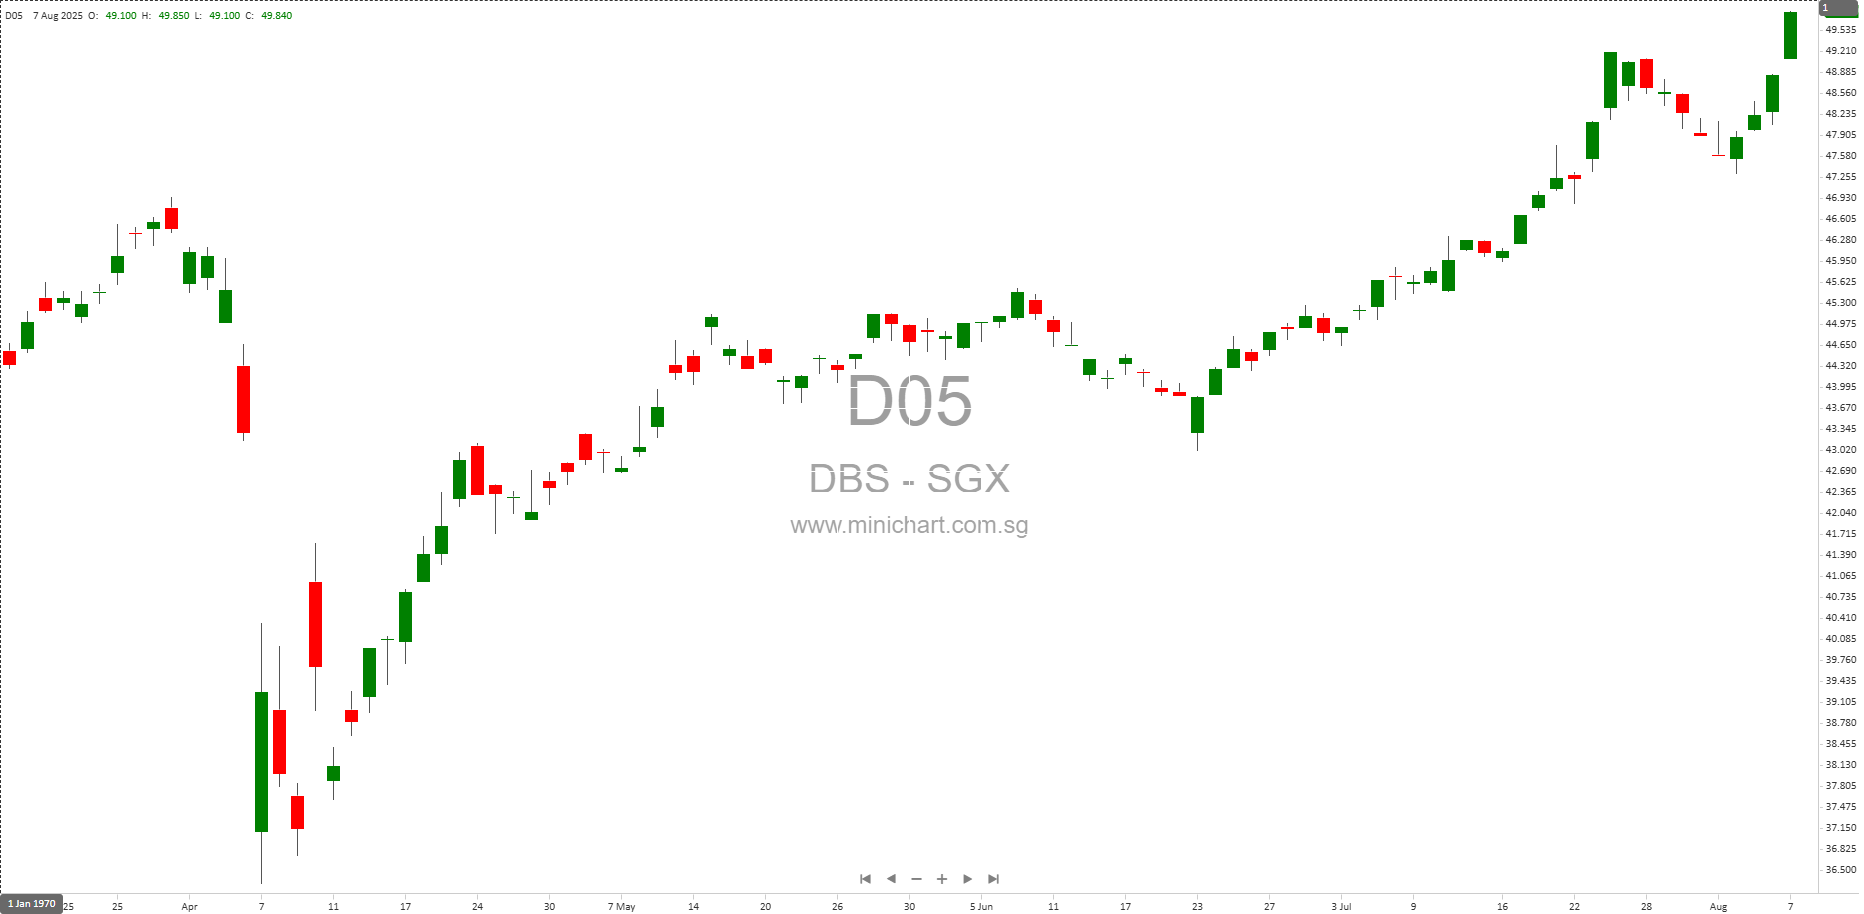
DBS Group Holdings Ltd (DBS), Southeast Asia’s largest bank by assets, delivered its unaudited results for the first half (1H25) and second quarter (2Q25) ended 30 June 2025. Despite facing heightened macroeconomic uncertainty, volatility in currency markets, and the implementation of the 15% global minimum tax, DBS achieved robust income growth, resilient asset quality, and maintained strong capital ratios. Below is a structured analysis of the key highlights from the report.
Key Financial Metrics
| Metric | 2Q25 | 1Q25 | 2Q24 | YoY Change | QoQ Change |
|---|---|---|---|---|---|
| Total Income (\$m) | 5,732 | 5,905 | 5,482 | +5% | -3% |
| Net Profit (\$m) | 2,824 | 2,897 | 2,803 | +1% | -3% |
| EPS (Basic & Diluted, \$) | 3.98 | 4.11 | 3.93 | +1% | -3% |
| Dividend per Share (Interim + Capital Return, \$) | 0.75 | 0.54 | 0.48 | +56% | +39% |
| Return on Equity (ROE, %) | 16.7 | 17.3 | 18.2 | -1.5 ppt | -0.6 ppt |
| Net Interest Margin (NIM, %) | 2.05 | 2.12 | 2.14 | -0.09 ppt | -0.07 ppt |
| Cost/Income Ratio (%) | 39.6 | 37.5 | 39.6 | 0 ppt | +2.1 ppt |
| Common Equity Tier-1 (CET-1) Ratio (%) | 17.0 | 17.4 | 14.8 | +2.2 ppt | -0.4 ppt |
Historical Performance Trends
- Net Profit: 1H25 net profit was \$5.72 billion, broadly unchanged from 1H24, despite a challenging macro environment and new tax implementation.
- Total Income: Rose 5% YoY to a record \$11.6 billion in 1H25, mainly from fee income and treasury customer sales. Net interest income grew due to strong deposit inflows offsetting lower interest rates.
- Asset Quality: NPL ratio improved to 1.0% from 1.1% at end-2024. Allowance coverage increased to 137% (236% including collateral).
- Balance Sheet: Customer loans grew 2% YoY (4% in constant currency). Deposits rose 4% YoY (7% in constant currency) to \$574 billion, with CASA ratio improving from 50% to 52%.
Dividends
- 2Q25 interim dividend: 60 cents per share (one-tier, tax-exempt)
- Capital return dividend: 15 cents per share (one-tier, tax-exempt)
- Total dividend for 2Q25: 75 cents per share (+56% YoY, +39% QoQ)
- Estimated payout: \$2.13 billion
Segment and Geographic Performance
- Consumer Banking/Wealth Management: 1H25 profit before tax up 2% YoY to \$2.40 billion. Non-interest income grew 20% on strong investment/bancassurance demand.
- Institutional Banking: 1H25 profit before tax down 7% YoY to \$3.09 billion, as lower NIM offset higher asset/deposit volumes and fee growth.
- Global Financial Markets (Markets Trading): 1H25 profit before tax soared over fivefold YoY to \$393 million, driven by trading income and improved trading environment.
- Singapore: Net profit fell 5% YoY to \$4.02 billion due to higher taxes; total income rose 4% YoY.
- Hong Kong: Net profit up 9% YoY to \$871 million, with strong fee and treasury income offsetting lower NIM.
Exceptional Items and Policy/Tax Changes
- 15% Global Minimum Tax: Effective from 2025, increased tax expense for Singapore operations.
- General Allowance Build-up: \$205 million set aside in 1Q25 for prudence given macro/geopolitical risks.
- No major divestments, IPOs, or asset sales disclosed; no material legal disputes or natural disaster impacts mentioned.
- Capital Management: Redemption of \$1.39 billion in perpetual capital securities; shares repurchased and cancelled (8 million shares in 1H25).
Share Capital Movements
- Issued shares at 2,838 million as of 30 June 2025 (down 8 million from start of year due to buybacks).
- Bonus shares: 258 million issued in April 2024 (affects per-share metrics for comparability).
Liquidity and Capital Adequacy
- Liquidity coverage ratio: 147%
- Net stable funding ratio: 114%
- CET-1 ratio: 17.0% (fully-phased Basel III: 15.1%)
- All regulatory capital and liquidity requirements exceeded by a comfortable margin.
Conclusion and Outlook
DBS’s 1H25 results highlight a resilient business model able to sustain robust income growth and asset quality amid a more challenging macroeconomic and regulatory environment. While headline net profit was flat YoY, this masks noteworthy underlying positives: record total income, strong growth in fee and trading income, improved deposit mix, and prudent risk management. The substantial increase in dividend payout further signals confidence in the bank’s capital position and future prospects.
Looking forward, the bank’s strong balance sheet, ample liquidity, and healthy capital ratios position it well to weather ongoing economic and rate headwinds. Risks remain from ongoing global macro and geopolitical uncertainty, but the current outlook remains broadly positive based on report disclosures.