CapitaLand Ascendas REIT 1H 2025 Financial Analysis
Key Financial Metrics & Year-on-Year / Quarter-on-Quarter Comparison
- Gross Revenue:
- 1H 2025: S\$754.8m
- 1H 2024: S\$770.1m (-2.0% YoY)
- 2H 2024: S\$753.0m (+0.2% QoQ)
- Net Property Income (NPI):
- 1H 2025: S\$523.4m
- 1H 2024: S\$528.4m (-0.9% YoY)
- 2H 2024: S\$521.5m (+0.4% QoQ)
- Total Amount Available for Distribution:
- 1H 2025: S\$331.1m
- 1H 2024: S\$330.8m (+0.1% YoY)
- 2H 2024: S\$338.0m (-2.0% QoQ)
- Distribution per Unit (DPU):
- 1H 2025: 7.477 cents
- 1H 2024: 7.524 cents (-0.6% YoY)
- 2H 2024: 7.681 cents (-2.7% QoQ)
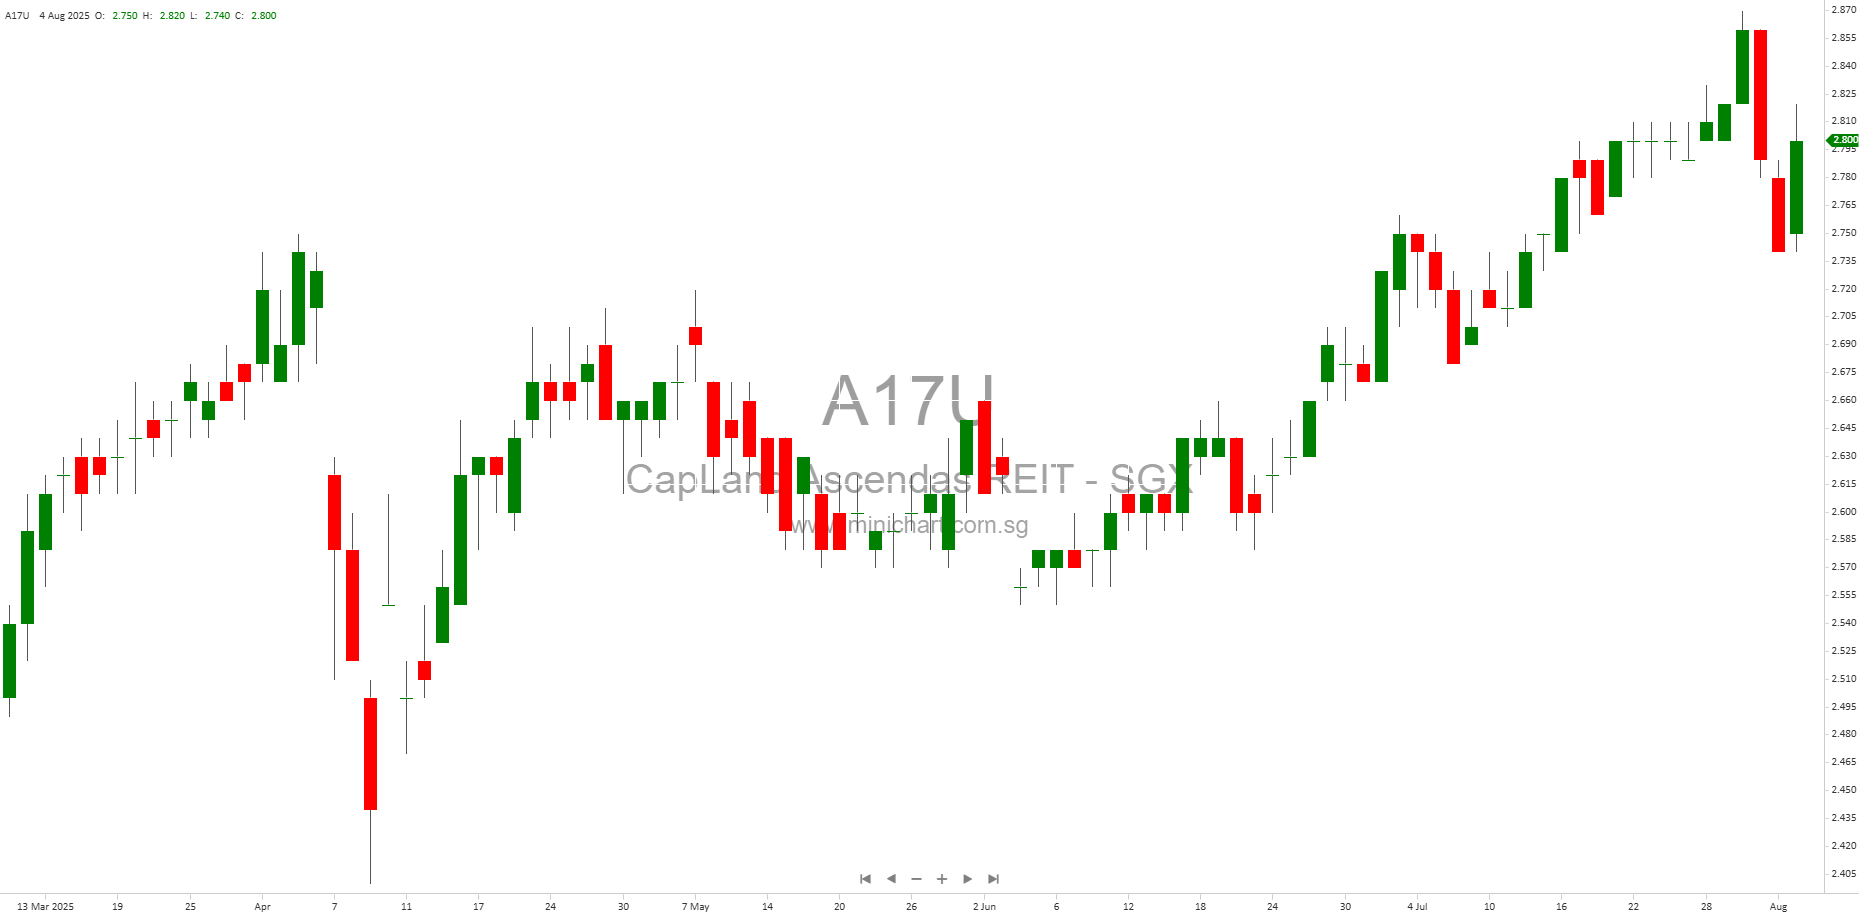
- Investment Properties Value:
- 30 Jun 2025: S\$16.83bn
- 31 Dec 2024: S\$16.76bn (+0.4% vs Dec 2024)
- Portfolio Occupancy:
- 30 Jun 2025: 91.8%
- 31 Dec 2024: 92.8% (-1.0ppt)
- Aggregate Leverage:
- 30 Jun 2025: 37.4%
- 31 Dec 2024: 37.7%
- Cost of Debt:
- 30 Jun 2025: 3.7%
- 31 Dec 2024: 3.7%
References: [[5]], [[7]], [[8]], [[17]], [[54]]
Historical Performance Comparison
- The REIT has shown a marginal decline in gross revenue and NPI YoY, but remains broadly stable QoQ.
- Distribution per unit has slightly decreased on both a YoY and QoQ basis, mainly due to a larger outstanding unit base from new placements and fee payments in units.
- Portfolio value and total assets have increased slightly, reflecting ongoing investment and acquisition activity.
- Occupancy has dipped marginally, particularly in Singapore and the US, but remains high overall.
References: [[5]], [[7]], [[8]], [[23]], [[54]]
Exceptional Earnings and Expenses
- There was a completed divestment of Parkside, Portland, US for S\$26.5 million, which represents a ~45% premium to market valuation (exceptional gain).
Reference: [[14]], [[15]]
New Shares Issuance and Dilution
- Increase in units due to:
- Private placement in Jun 2025
- Issuance of units for payment of divestment and base management fees
Applicable number of units increased from 4,397m (1H 2024) to 4,428m (1H 2025) [[7]], [[8]].
Proposed Dividend and Change from Previous Period
- 1H 2025 DPU: 7.477 cents (down from 7.524 cents in 1H 2024 and 7.681 cents in 2H 2024).
- Distribution timetable:
- Last day cum: 8 August 2025
- Ex-date: 11 August 2025
- Record date: 12 August 2025
- Payable: 4 September 2025
Reference: [[9]], [[54]]
Potential Divestments and Fund Inflows
- Recent completed divestment (Parkside, Portland, US) and announced/approved acquisitions (9 Tai Seng Drive and 5 Science Park Drive).
- No mention of potential listing or IPO of assets.
References: [[11]], [[12]], [[13]], [[14]], [[15]]
Asset Revaluation and Delays
- No explicit mention of asset revaluations or delays. However, the value of investment properties is updated as of 30 Jun 2025 and compared with previous periods.
Insights from the Report
- The portfolio remains diversified with stable performance despite macroeconomic uncertainties.
- Management is proactive in portfolio optimisation through acquisitions, redevelopments, and divestments.
- Aggregate leverage and debt costs are well managed, with strong natural hedges for overseas investments.
- There is a continued focus on sustainability and green certification, supporting long-term investor confidence.
- However, slight declines in occupancy and DPU could signal challenges in leasing or rental rates, and ongoing macroeconomic risks (interest rates, global trade tensions) persist.
References: [[5]], [[17]], [[20]], [[21]], [[36]], [[43]]
Market and Macro Environment Risks
- IMF projects lower global growth (2.8% in 2025, 3.0% in 2026), citing trade tensions and financial market adjustments as downside risks.
- Singapore: GDP growth forecast at 0.0%-2.0%, uncertainties in H2 2025. Core inflation remains low but monetary policy is cautious.
- US: Growth at 1.8% for 2025, Fed maintains rates amid inflation concerns.
- Australia: Growth at 1.6% for 2025, inflation within RBA target.
- UK/EU: Modest growth forecasts, central banks maintain cautious policy stance.
References: [[38]], [[39]], [[40]], [[41]], [[42]], [[43]]
Other Notable Investor Information
- Portfolio WALE stands at 3.7 years with good lease expiry spread.
- Large and diversified tenant base, with top 10 customers contributing 14.9% of gross revenue.
- Strong sustainability focus: 49% green-certified properties, 59% green lease coverage, S\$2.6b in green financing.
- No mention of director pay, buyback mandates, or legal disputes.
References: [[30]], [[31]], [[32]], [[45]], [[46]], [[50]], [[51]], [[52]]
Chairman Statement
No Chairman’s Statement was included or extracted in the provided report.
Conclusion & Analyst Opinion
Overall, CapitaLand Ascendas REIT maintains a stable and resilient financial and operational performance, underpinned by its diversified portfolio and prudent capital management. The focus on sustainability and ongoing asset enhancement supports future value, although marginal declines in occupancy and DPU highlight areas to monitor. Macro headwinds remain a risk, but the REIT’s strong balance sheet and tenant diversification provide important buffers. The report is generally positive, with no red flags or material errors noted.