Oxford Square Capital Corp. Announces Q2 2026 Financial Results and Declares Upcoming Distributions
Summary of Key Financial Results
- Net Asset Value (NAV) per share: \$1.29 as of June 30, 2026 (down from \$1.32 at March 31, 2026).
- Net Investment Income (NII): \$5.1 million (\$0.05 per share) for Q2 2026, up from \$4.1 million in Q1 2026.
- Total Investment Income: \$9.4 million for Q2 2026, up from \$8.9 million in Q1 2026.
- Total Expenses: \$4.3 million for Q2 2026, down from \$4.8 million in Q1 2026.
- Net Increase in Net Assets from Operations: \$4.0 million, comprised of NII (\$5.1 million), net realized losses (\$5.2 million), and net unrealized appreciation (\$4.1 million).
- Distributions Declared: \$0.035 per share for each of October, November, and December 2026.
Detailed Investment Income Breakdown
- Debt Investments: \$5.4 million
- CLO Equity Investments: \$3.5 million
- Other Income: \$0.5 million
Yield Metrics and Portfolio Performance
- Weighted Average Yield of Debt Investments: 14.9% (up from 14% in Q1)
- Weighted Average Effective Yield of CLO Equity Investments: 8.1% (up from 7.3% in Q1)
- Weighted Average Cash Distribution Yield (Senior Secured Notes): 8.0% (unchanged)
- Weighted Average Cash Distribution Yield (CLO Equity): 12.4% (down from 13.6% in Q1)
Portfolio and Investment Activity
- Investment Purchases: \$19.9 million in Q2 2026
- Investment Repayments: \$0.5 million; no sales made during the quarter.
- Weighted Average Credit Rating: 2.1 (fair value basis), 2.2 (principal basis) as of June 30, 2026; improved from 2.2 and 2.4, respectively, in Q1.
- Non-Accrual Investments: Preferred equity investments in one portfolio company, fair value of \$6.9 million.
- Common Stock Issued: 11.3 million shares via at-the-market offering; net proceeds of \$17.8 million. Total shares outstanding: 105.1 million as of June 30, 2026.
Statements of Assets and Liabilities (as of June 30, 2026)
- Total Assets: \$290.6 million
- Total Liabilities: \$155.6 million
- Total Net Assets: \$135.0 million
- Notes Payable: \$79.7 million (5.50% Unsecured Notes), \$72.4 million (7.75% Unsecured Notes)
- Net Asset Value per Common Share: \$1.29 (down from \$1.69 at December 31, 2025)
Statements of Operations (Q2 2026 vs Q2 2025)
| Item | Q2 2026 | Q2 2025 |
|---|---|---|
| Interest Income (Debt Investments) | \$4,535,789 | \$4,228,193 |
| Interest Income (PIK) | \$896,600 | \$857,257 |
| Income from Securitization Investments | \$3,508,746 | \$3,855,072 |
| Other Income | \$460,958 | \$581,659 |
| Total Investment Income | \$9,402,093 | \$9,522,181 |
| Total Expenses | \$4,264,028 | \$4,022,616 |
| Net Investment Income | \$5,138,065 | \$5,499,565 |
| Net Change in Unrealized Appreciation | \$4,071,759 | \$1,253,135 |
| Net Realized Losses | (\$5,216,274) | (\$2,367,343) |
| Net Increase in Net Assets from Operations | \$3,993,550 | \$4,385,357 |
Financial Highlights and Shareholder Information
- Distributions Per Share: \$0.105 for Q2 2026 (annualized \$0.42)
- Net Asset Value per Share: \$1.29 at end of Q2 2026 (down from \$2.06 at Q2 2025)
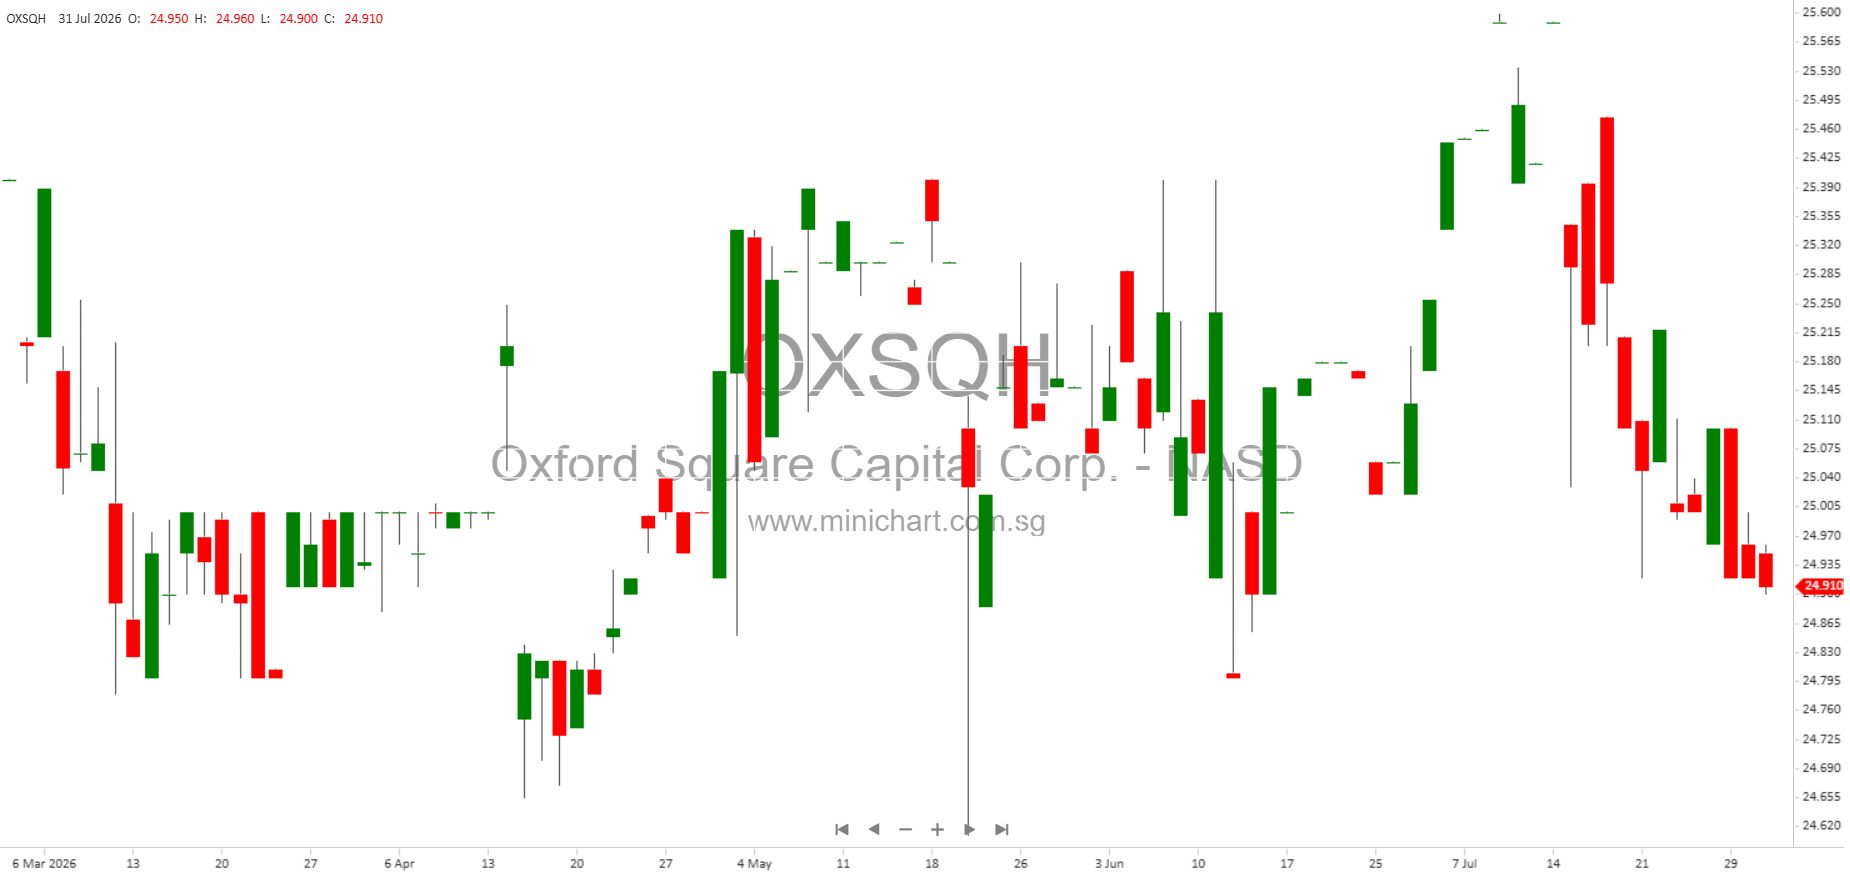
- Market Value Return: -19.75% for Q2 2026 (vs -10.49% in Q2 2025)
- Net Asset Value Return: 5.68% for Q2 2026 (vs 3.59% in Q2 2025)
- Shares Outstanding: 105,058,242 at end of Q2 2026 (up from 76,236,738 in Q2 2025)
- Ratio of Expenses to Average Net Assets: 14.39% for Q2 2026 (up from 10.78% in Q2 2025)
- Ratio of Net Investment Income to Average Net Assets: 14.66% for Q2 2026 (up from 14.26% in Q2 2025)
- Portfolio Turnover Rate: 0.19% for Q2 2026
Important Shareholder and Price-Sensitive Information
- Declining NAV per share: Indicates erosion of asset value, which may negatively impact share price.
- Increasing Net Investment Income: Positive sign that could support distributions and shareholder returns.
- Significant Net Realized Losses: \$5.2 million in Q2 2026; offset by unrealized appreciation but may signal portfolio risk.
- Non-Accrual Investments: \$6.9 million in preferred equity investments on non-accrual could be a concern for asset quality.
- Large Share Issuance: 11.3 million new shares issued; dilution risk but brings in \$17.8 million net proceeds for company growth and liquidity.
- Distribution Announcements: Three monthly distributions of \$0.035 per share for October, November, and December 2026.
- Yield Improvements: Debt and CLO yields are up, but some CLO equity yields have declined, impacting future income.
- Change in Credit Ratings: Portfolio credit quality improved slightly.
- Elevated Expense Ratio: Expense ratio is notably high at 14.39% of average net assets, which may affect profitability and investor sentiment.
- Market Value Return: Substantial negative market value return (-19.75% in Q2) signals market skepticism or reaction to asset value changes.
Conference Call and Further Information
Oxford Square Capital Corp. will hold a conference call to discuss second quarter results on July 31, 2026, at 9:00 AM ET. Investors can dial 1-800-715-9871 (access code: 8149397) to participate, and a recording will be available for 30 days at 1-800-770-2030 (replay pass-code: 8149397#). Additional details are available on the company’s website under the Investor Relations section.
About Oxford Square Capital Corp.
Oxford Square Capital Corp. is a publicly-traded business development company primarily investing in syndicated bank loans and, to a lesser extent, in debt and equity tranches of collateralized loan obligation (CLO) vehicles. CLO investments may also include warehouse facilities, used as financing structures to aggregate loans for future CLO vehicles.
Conclusion
This quarterly report contains several price-sensitive developments for Oxford Square Capital Corp. investors. While net investment income is rising and yields are improving, NAV per share continues to decline, and realized losses are substantial. Non-accrual investments and a large share issuance are potential risks. Distributions remain steady, but elevated expenses and negative market value returns could weigh on the share price. Investors should monitor ongoing portfolio quality and management’s response to these challenges.
Disclaimer
The information above is based on Oxford Square Capital Corp.’s Q2 2026 financial report and is provided for informational purposes only. This article does not constitute investment advice, and investors should conduct their own due diligence and consult with professional advisors before making investment decisions. Forward-looking statements are subject to risks and uncertainties that may cause actual results to differ materially from those projected. Oxford Square Capital Corp. undertakes no obligation to update such statements except as required by law.