Xenia Hotels & Resorts, Inc. Reports Q2 2026 Results: Key Financials, Performance Trends, and Shareholder Insights
Overview
Xenia Hotels & Resorts, Inc. (NYSE: XHR) has released its unaudited financial results for the second quarter and six months ended June 30, 2026. The results reflect significant operational and financial developments that investors and shareholders should closely examine, as they may have implications for share value and future company strategy.
Key Highlights from Q2 2026 Report
- Revenue Performance: For the six months ended June 30, 2026, Xenia reported total revenues of \$591.7 million, indicating a robust performance compared to prior periods.
- Net Income / Loss: The company posted a net income of \$58.6 million for the first half of 2026, a notable turnaround from a net loss of \$20.7 million in the same period the previous year. For Q2 alone, net income attributable to common stockholders was \$55.2 million.
- Operating Income: Operating income for the six months ended June 30, 2026, stood at \$76.1 million, up from \$41.7 million in the comparable period.
- Asset Impairments: The report records a significant impairment charge of \$8.8 million during Q2 2026.
- Gain on Sale of Properties: A major driver of profitability was a \$40 million gain on sale of properties, which is a material, potentially price-moving event.
- Interest Expense: Interest expense for the period was \$41.4 million.
- Cash and Cash Equivalents: As of June 30, 2026, the company held \$118.2 million in cash and cash equivalents.
- Total Assets and Equity: Total assets at quarter end were \$2.72 billion, with total equity (including non-controlling interests) at \$1.16 billion.
- Share Count: There were 92,245,835 shares of common stock outstanding as of July 29, 2026.
- Dividends: Distributions payable as of June 30, 2026, were \$13.7 million.
- EPS: Basic and diluted earnings per share for the six months were \$0.56, compared to a loss per share of \$0.21 in the prior period.
- Comprehensive Income: Comprehensive income for the six months was \$58.4 million.
Important Shareholder and Price-Sensitive Developments
-
Significant Gain on Asset Sales:
The \$40 million gain on sale of properties is a substantial, non-recurring income item that contributed meaningfully to the swing from a loss to a profit. Such gains may not be repeated in future quarters and should be considered when evaluating ongoing earnings power. -
Impairment Charges:
A \$8.8 million impairment charge was recognized, which could reflect changes in asset values or outlook for certain properties. Investors should monitor for further impairments as this may impact book value and future earnings. -
Improved Profitability and EPS:
The return to profitability and positive EPS is likely to be viewed favorably by the market, especially when compared to losses in the previous year. However, the sustainability of this improvement must be assessed in light of non-recurring items. -
Strong Balance Sheet:
With \$118.2 million in cash and a stable equity base, Xenia maintains strong liquidity. This could support further acquisitions, dividends, or share repurchases — all potentially positive for share price. -
Dividend Consistency:
Continued payment of dividends (\$13.7 million payable) demonstrates management’s commitment to shareholder returns. -
Share Count Stability:
Little change in outstanding shares indicates no significant dilution, which is positive for existing shareholders.
Financial Statements – Detailed Breakdown
Condensed Consolidated Balance Sheets (as of June 30, 2026 and December 31, 2025)
- Net Investment Properties: \$2.42 billion (down from \$2.50 billion at year-end 2025).
- Cash and Cash Equivalents: \$118.2 million (down from \$162.5 million at year-end 2025).
- Total Assets: \$2.72 billion (down from \$2.81 billion at year-end 2025).
- Total Liabilities: \$1.55 billion (down from \$1.63 billion at year-end 2025).
- Total Equity (including non-controlling interests): \$1.16 billion (down from \$1.18 billion at year-end 2025).
Condensed Consolidated Statements of Operations (Six Months Ended June 30, 2026)
- Total Revenues: \$591.7 million
- Cost of Revenues: \$393.8 million
- Operating Income: \$76.1 million
- Net Income: \$58.6 million
- Net Income Attributable to Common Stockholders: \$55.2 million
- Earnings Per Share (Basic and Diluted): \$0.56
- Weighted Average Shares Outstanding: 97.7 million (basic)
Potential Share Price Implications
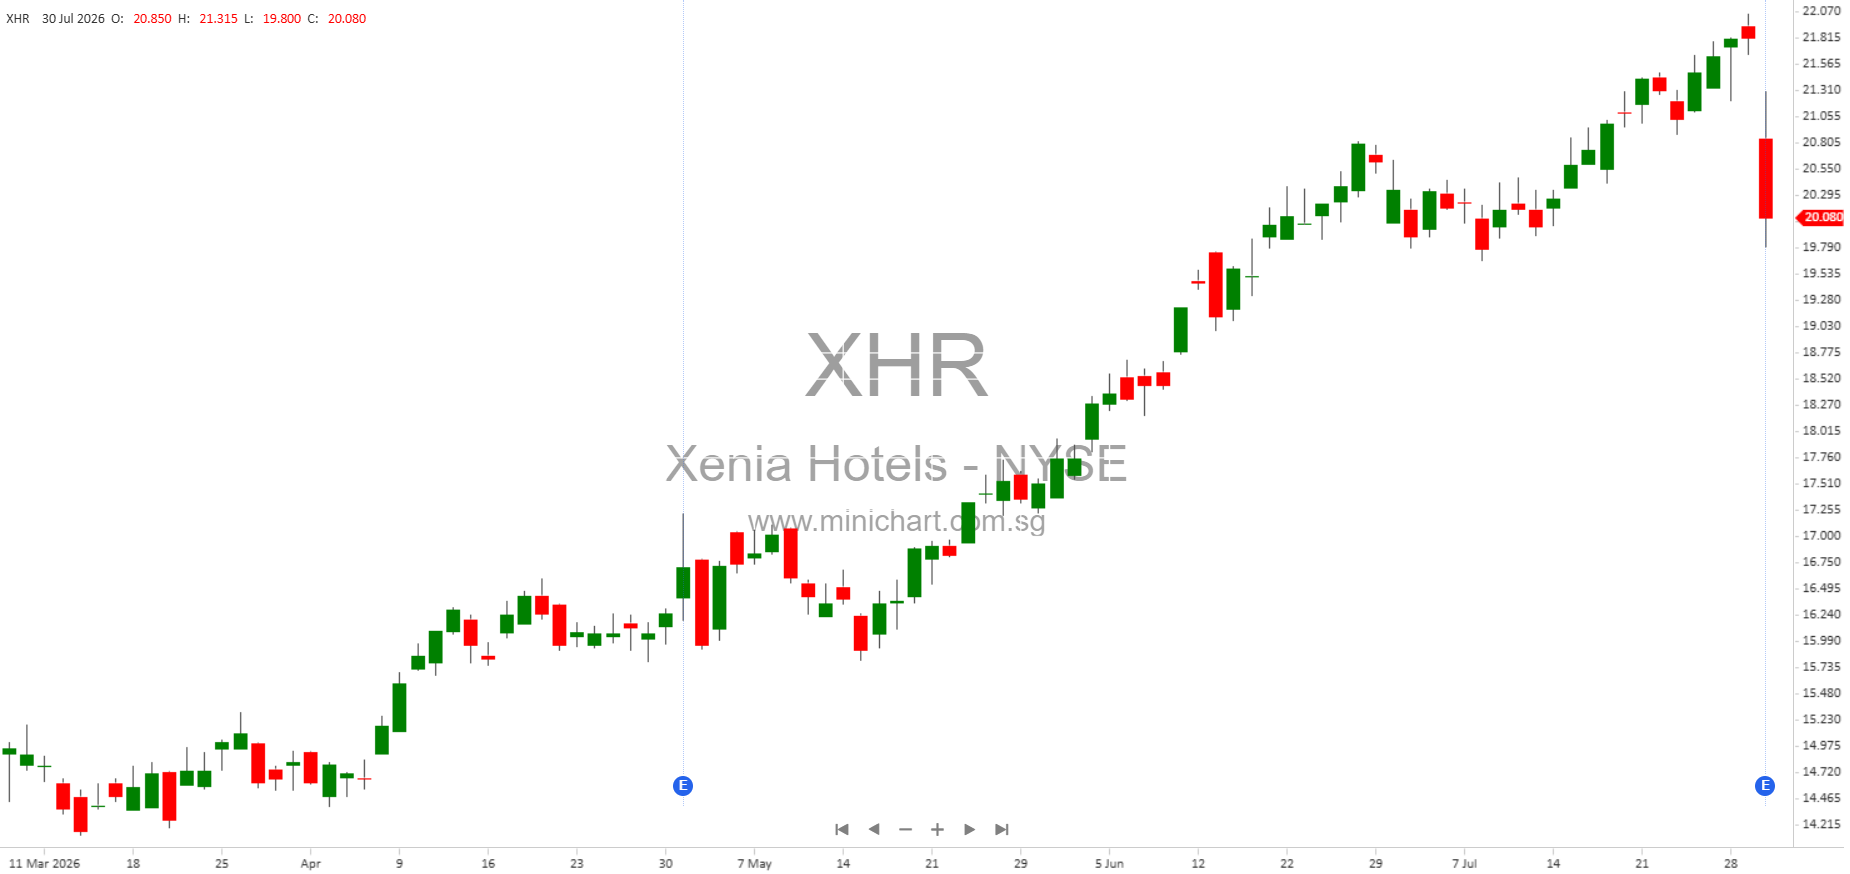
The strong recovery in profitability, driven by asset sales, improved operating income, and a clear demonstration of balance sheet strength, are all positive signals for investors and may be catalysts for upward share price movement. However, investors should remain cautious about the sustainability of earnings given the significant contribution from non-operational gains and the recognition of asset impairments.
Other Noteworthy Items
- Regulatory Compliance: The company confirms full compliance with SEC filing requirements and interactive data rules.
- Filer Status: Xenia is classified as a large accelerated filer, not a smaller reporting company or emerging growth company, and is not a shell company.
Conclusion
Xenia Hotels & Resorts has delivered a quarter marked by a substantial positive earnings swing, primarily owing to strategic asset sales. The company maintains a solid financial position and continues to reward shareholders with dividends. While these results are encouraging and may support a positive re-rating of the stock, investors should closely monitor future quarters for underlying operational performance and recurring earnings quality.
Disclaimer: This article is based on the unaudited financial statements and disclosures of Xenia Hotels & Resorts, Inc. for Q2 2026. It is intended for informational purposes only and does not constitute investment advice or a recommendation to buy or sell any securities. Investors should conduct their own due diligence and consult a qualified financial advisor before making investment decisions. The author and publisher are not responsible for any errors, omissions, or outcomes resulting from the use of this information.