Perella Weinberg Partners Reports Q2 2026 Results: Steady Revenue, Strategic Talent Additions, and Robust Capital Management
Key Highlights from Q2 2026 Earnings Report
- Q2 2026 Revenues: \$156.5 million, a slight increase of 1% compared to Q2 2025.
- Q2 2026 GAAP Diluted EPS: \$0.06; Adjusted EPS: \$0.20.
- First Half 2026 Revenues: \$305.4 million, down 17% year-over-year.
- First Half 2026 GAAP Diluted EPS: \$0.08; Adjusted EPS: \$0.25.
- GAAP Pre-Tax Income: \$6 million in Q2; Adjusted Pre-Tax Income: \$27 million.
- Capital Management: \$116 million in cash, no debt, \$73 million returned to equity holders year-to-date.
- Share Buybacks: Over 2 million shares retired year-to-date.
- Dividend: Quarterly dividend of \$0.07 per share declared.
- Talent Investments: 10 new partners and 11 managing directors added YTD; further senior hires and the acquisition of Gleacher Shacklock expected in Q3.
- Business Realignment: Headcount reductions and realignment costs to focus on high-performing areas, with \$22 million in associated costs projected through end of 2026.
Detailed Financial Performance
Revenue Trends
Perella Weinberg reported Q2 2026 revenues of \$156.5 million, up 1% from \$155.3 million in Q2 2025. This modest increase was driven by a higher number of fee-paying clients and stronger M&A activity, but was partly offset by a decline in financing and capital solutions revenue. For the first half of 2026, revenues were \$305.4 million, reflecting a 17% decrease from \$367.1 million in the same period last year. The decline is attributed to fewer large fee events and a lower average fee per client, though M&A revenues were up year-over-year.
Expense Management and Margins
- GAAP Total Compensation and Benefits: \$115.9 million in Q2 2026, up from \$108.3 million in Q2 2025, mainly due to increased cash compensation, new hires, and costs tied to business realignment and headcount reductions.
- Adjusted Total Compensation and Benefits: \$98.8 million in Q2 2026, down from \$104.0 million in the previous year, owing to a lower discretionary bonus accrual but partially offset by higher compensation for new hires. The adjusted compensation margin improved to 71% YTD from 79% in Q1 2026.
- Non-Compensation Expenses: GAAP non-comp expenses were \$35.6 million in Q2 2026 (down from \$38.0 million). Adjusted non-comp expenses were \$31.4 million (down from \$36.4 million), helped by lower professional fees due to litigation insurance recoveries and reduced G&A expenses.
Profitability
- Q2 2026 GAAP Pre-Tax Income: \$6.1 million (up from \$6.2 million in Q2 2025).
- Q2 2026 Adjusted Pre-Tax Income: \$27 million.
- Q2 2026 GAAP Net Income: \$6.3 million; Net Income Attributable to PWP: \$5.3 million.
- Q2 2026 GAAP Diluted EPS: \$0.06; Adjusted EPS: \$0.20.
Capital Management and Shareholder Returns
- Cash Position: \$115.8 million in cash, no debt, undrawn revolving credit facility.
- Share Repurchases: 2.76 million share equivalents retired at \$20.12 per share average YTD.
- Dividends: \$14.9 million paid YTD; \$0.07 per share dividend declared for Q2, payable September 10, 2026.
- Future Realignment Payments: \$7.6 million in estimated cash payments for business realignment expected by or after December 31, 2026.
Strategic Initiatives and Talent Investment
- 10 partners and 11 managing directors added year-to-date.
- Six more partners and three managing directors set to join in coming months.
- The acquisition of UK-based Gleacher Shacklock is expected to close in Q3 2026, further expanding the firm’s advisory capabilities and European footprint.
Tax and Adjusted Results
- Tax Benefit: \$10.1 million tax benefit for H1 2026, largely from RSUs vesting at higher share prices.
- Adjusted results are presented as if all partnership units had been converted to Class A shares and all income was taxed at the corporate rate, making adjusted EPS and margins more relevant for investors analyzing ongoing performance.
Discussion and Shareholder Takeaways
Momentum is building in the business, as highlighted by CEO Andrew Bednar, with a faster pace of announced transactions and a robust backlog of booked revenue, announced, and pending deals compared to last year. The firm’s clear strategy to scale—by bringing in senior talent and executing targeted acquisitions—positions it for future growth.
The planned acquisition of Gleacher Shacklock is a major strategic move that should draw investor attention, as it signals further international expansion and an enhanced ability to serve European clients. This, combined with significant senior hiring and a disciplined approach to realigning resources toward high-performing business areas, could provide long-term value creation for shareholders.
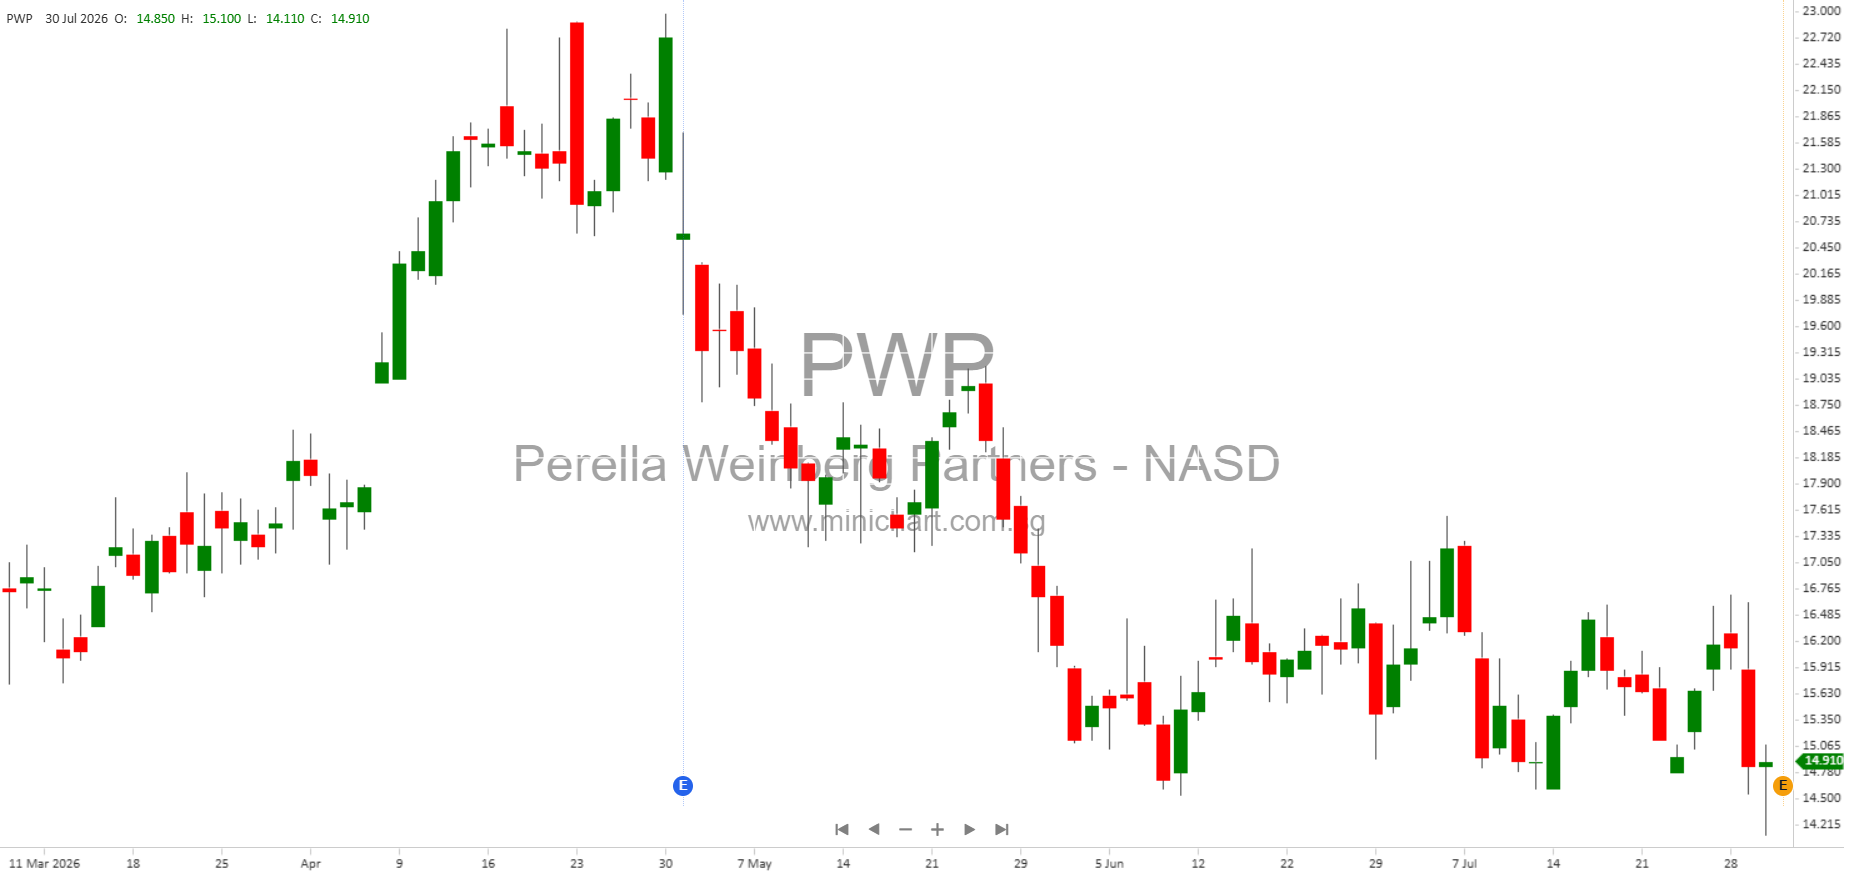
Capital management remains a highlight: PWP’s strong cash position, lack of debt, and active return of capital via both buybacks and dividends should be viewed positively by investors seeking steady returns and financial discipline.
However, the 17% year-over-year decline in H1 revenues and a higher compensation margin due to new hires and realignment costs are key risks and areas for monitoring, especially if revenue growth does not accelerate in the coming quarters.
The firm’s business realignment—including headcount reductions and related charges—represents both a short-term expense and a longer-term margin improvement opportunity if execution is successful.
Potential Share Price Impacts
- Positive: Ongoing buybacks, dividend payments, international expansion, and strong M&A pipeline/backlog signal confidence and shareholder return focus.
- Negative/Risks: Year-over-year revenue decline, elevated compensation expenses, and execution risk around business realignment and integration of acquisitions.
- Watch for: Completion of the Gleacher Shacklock acquisition in Q3, further senior hires, and continued progress in revenue growth and margin improvement.
Disclaimer: This article is for informational purposes only and does not constitute investment advice or an offer to buy or sell any security. Investors should conduct their own due diligence and consult with their financial advisor before making investment decisions. All financial figures are based on Perella Weinberg Partners’ Q2 2026 press release and are subject to change. Past performance is not indicative of future results.