Oppenheimer Holdings Inc. Reports Strong Q2 2026 Earnings: Record Revenues, Adjusted Profits, and Key Compensation Impact
Key Highlights for Investors
- Q2 2026 Net Income: \$27.4 million (\$2.55 basic EPS), up from \$21.7 million (\$2.06 EPS) in Q2 2025.
- Q2 2026 Revenue: \$454.9 million, a 21.9% increase from \$373.2 million a year ago.
- Year-to-date Revenue (H1 2026): \$900 million, up from \$741 million in H1 2025.
- Year-to-date Net Income (H1 2026): \$6.8 million (\$0.63 EPS), sharply lower than \$52.3 million (\$4.99 EPS) for H1 2025, primarily due to one-off legal accruals.
- Significant Non-GAAP Adjustments: Adjusted net income for Q2 2026 was \$45.7 million (\$4.27 EPS), compared to \$27.8 million (\$2.64 EPS) in Q2 2025. For H1 2026, adjusted net income was \$93.2 million (\$8.73 EPS), compared to \$56.4 million (\$5.38 EPS) for H1 2025.
- Pre-tax Legal Accrual: \$70 million in Q1 2026 relating to settlement of the “cash sweep” litigation.
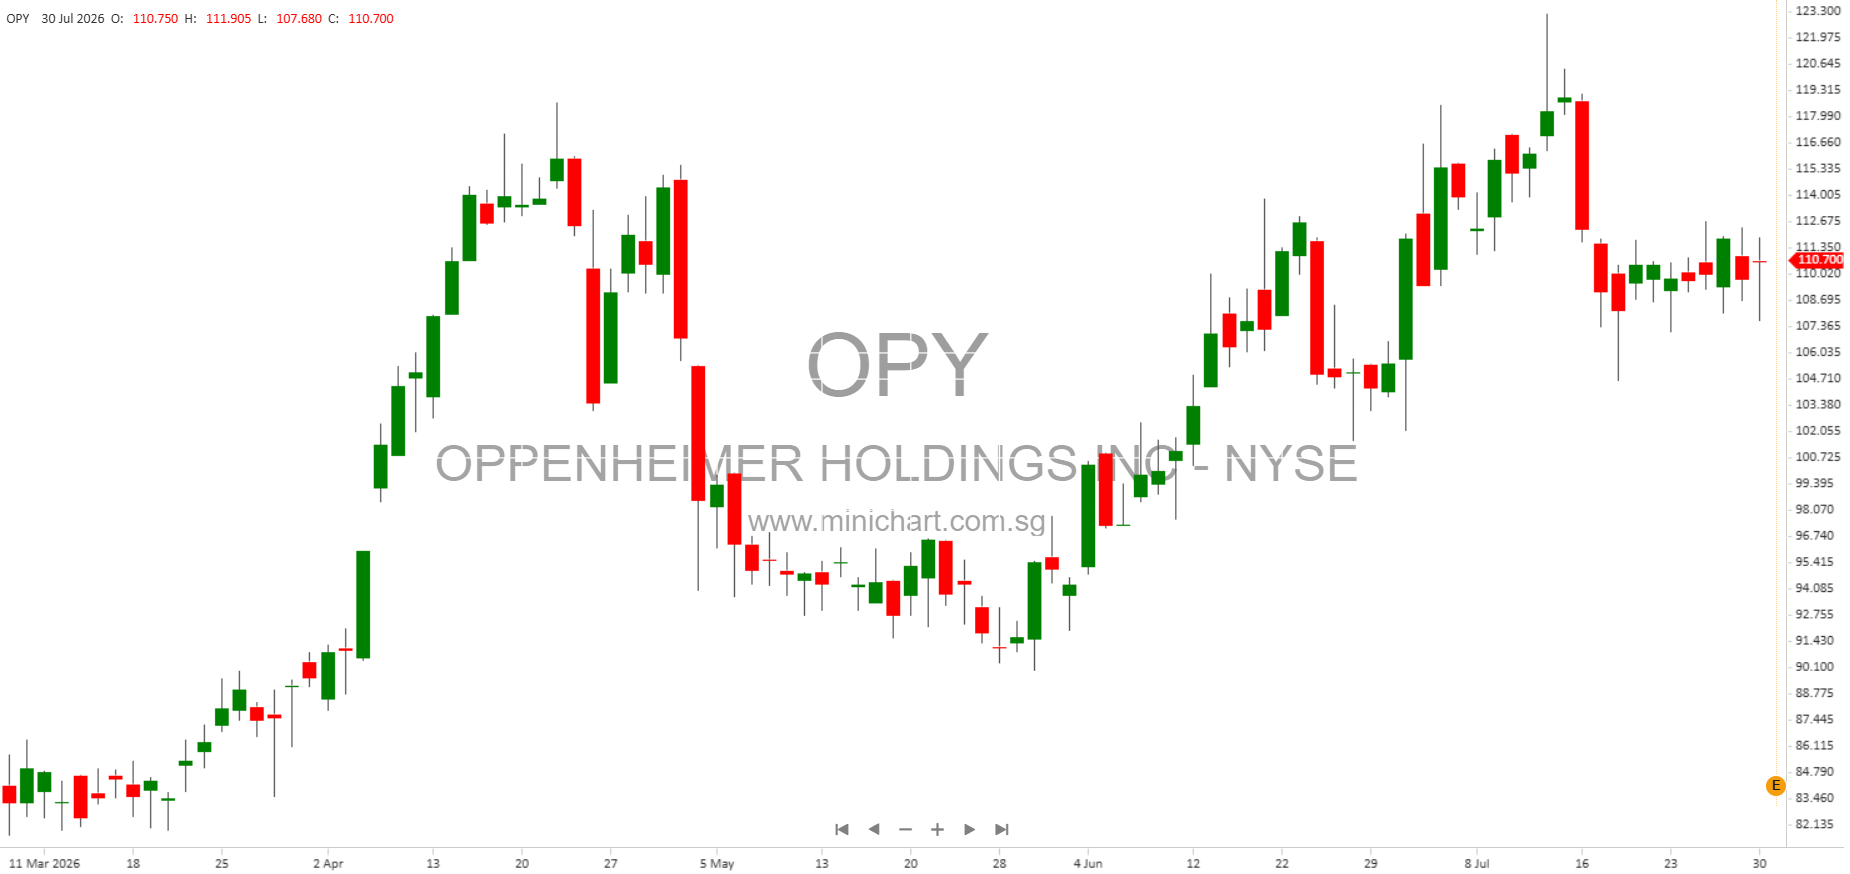
- Stock Appreciation Rights (SARs) Expense: \$24.9 million pre-tax expense in Q2 2026, tied to a \$16.35 increase in OPY share price (from \$89.19 to \$105.54).
- Dividend Announcement: Quarterly dividend of \$0.20 per share payable August 28, 2026.
Detailed Financial Performance
Revenue and Earnings Growth
Oppenheimer Holdings posted robust top-line growth in the second quarter of 2026, with revenue up 21.9% year-over-year to \$454.9 million. Earnings per share also improved, despite a significant, non-operational compensation expense tied to the company’s stock price appreciation. Excluding non-GAAP adjustments, the reported net income was \$27.4 million, a 26% increase from the prior year. Adjusted earnings, however, soared to \$45.7 million, reflecting the firm’s strong core operating performance.
Year-to-date, revenue reached \$900 million, a 21.5% increase over the same period last year. However, net income for the six months plummeted to \$6.8 million (\$0.63 EPS), down 87% from \$52.3 million (\$4.99 EPS) in H1 2025, primarily due to the \$70 million pre-tax legal settlement in Q1 2026.
Impact of Stock Appreciation Rights Compensation
A major factor affecting reported earnings was a \$24.9 million pre-tax expense related to the employee compensation program for financial advisors, which is directly tied to the OPY stock price. The Company revised the program formula in early 2026 to reduce the number of grants, but it will take several years before the impact of these changes is fully seen. This expense spiked as the share price increased significantly during the quarter.
Management believes this compensation expense, while recurring, is highly volatile and largely outside the company’s direct control, as it is linked to movements in the share price. As a result, the company provides adjusted (non-GAAP) earnings to more accurately reflect its core operating performance.
Wealth Management Division
- Q2 2026 Revenue: \$272.7 million, up 10.7% year-over-year.
- Pre-tax Income: \$55.7 million, down 11.4% due to higher compensation expenses.
- Financial Advisor Headcount: 934, up from 927 in Q2 2025.
- Record Assets Under Management (AUM): \$59.4 billion (up \$6.6 billion YoY), driven by \$9.4 billion in asset value appreciation offset by \$2.8 billion in net client distributions.
- Assets Under Administration (AUA): \$154.7 billion.
- Increased Advisory Fees: Up 15.9% due to higher AUM.
- Reduced Bank Deposit Sweep Income: Down by \$3.7 million due to lower short-term interest rates.
Wealth Management saw strong operating results, particularly from increased retail trading and higher advisory fees. However, pre-tax profits were partially offset by a spike in compensation costs due to the SARs program and higher production-related expenses.
Capital Markets Division
- Q2 2026 Revenue: \$179.2 million, up 45.7% from Q2 2025.
- Pre-tax Income: \$22.5 million, reversing a loss of \$3.9 million in Q2 2025.
- Investment Banking: Advisory fees surged 158.5% due to strong closings in the financial institutions sector; equities underwriting fees rose 46%.
- Sales & Trading: Equities sales and trading revenue increased 37.8%, while fixed income revenues grew modestly amid elevated market volatility.
- Compensation Expenses: Up 36.3%, driven by higher incentive accruals.
The significant turnaround in Capital Markets was driven by a large increase in advisory and underwriting activity, especially within investment banking, and robust trading volumes in both equities and fixed income.
Balance Sheet and Capital Position
- Stockholders’ Equity: \$983.4 million (up from \$896.9 million in Q2 2025).
- Regulatory Net Capital: \$444.8 million (up from \$408.9 million YoY).
- Book Value per Share: \$91.84 (up from \$85.27).
- Tangible Book Value per Share: \$71.19 (up from \$68.25).
- No Common Stock Repurchases in Q2 2026 (compared to \$0.6 million and 9,855 shares in Q2 2025).
The company finished Q2 2026 with a strong balance sheet and ample regulatory capital, supporting its ability to invest in growth and return capital to shareholders.
Dividends and Shareholder Returns
Oppenheimer’s Board of Directors declared a quarterly dividend of \$0.20 per share, payable on August 28, 2026, to shareholders of record as of August 14, 2026. This dividend announcement underscores the company’s ongoing commitment to returning value to shareholders.
Management’s Commentary and Market Outlook
President and CEO Robert S. Lowenthal highlighted that favorable market conditions, notably the best quarterly equity market performance in six years, drove robust results across core business lines. Management remains confident in the company’s ability to invest in its platform, attract and retain top talent, and deliver value to clients and shareholders. However, he acknowledged the negative impact of the higher SARs compensation expense on reported results.
Looking ahead, management noted potential risks from interest rate concerns and AI valuations but stressed the company’s resilience and strong capital position.
Non-GAAP Financial Disclosure
Investors should note that Oppenheimer adjusts its reported earnings to exclude the impact of SARs compensation expense (which is highly volatile and not fully controllable by the company) and the one-time legal settlement. This provides a clearer view of the firm’s ongoing operating performance.
| Metric | Q2 2026 | Q2 2025 | H1 2026 | H1 2025 |
|---|---|---|---|---|
| Net Income (GAAP) | \$27.4M | \$21.7M | \$6.8M | \$52.3M |
| Adjusted Net Income (Non-GAAP) | \$45.7M | \$27.8M | \$93.2M | \$56.4M |
| Basic EPS (GAAP) | \$2.55 | \$2.06 | \$0.63 | \$4.99 |
| Adjusted Basic EPS (Non-GAAP) | \$4.27 | \$2.64 | \$8.73 | \$5.38 |
Potentially Price-Sensitive Information
- Significant Positive: Substantial growth in revenue and adjusted earnings, record AUM and AUA, and strong performance in both Wealth Management and Capital Markets signal strong business momentum.
- Material Negative: High compensation expenses tied to SARs and the \$70 million one-time legal settlement significantly reduced reported net income for H1 2026, although these are largely non-operational in nature.
- Dividend Declaration: Ongoing shareholder returns support the investment case.
- Revised Compensation Program: While the SARs expense remains volatile, the company has changed its formula to reduce future volatility, though full effects will take several years to materialize.
Forward-Looking Statements
Management issued the customary caution that forward-looking statements are subject to risks and uncertainties, including market conditions, interest rate fluctuations, regulatory matters, and litigation, among others.
Disclaimer: This article is based on the company’s Q2 2026 earnings press release and is intended for informational purposes only. It does not constitute investment advice. Investors should review the full company filings and consult with their financial advisors before making any investment decisions. Past performance is not indicative of future results.