LendingTree, Inc. Q2 2026 Financial Results: Key Insights for Investors
LendingTree, Inc. (Nasdaq: EE) has released its quarterly Form 10-Q for the period ending June 30, 2026. This report provides a comprehensive look into the company’s financial condition, significant events, and shareholder equity changes that may have material implications for investors.
Key Highlights from the Quarterly Report
- Quarterly Reporting and Compliance: LendingTree has confirmed it has filed all required reports under Sections 13 or 15(d) of the Securities Exchange Act of 1934 for the last 12 months and remains in good standing. The company is not considered a shell company.
- Exchange and Listing: Shares are traded on The Nasdaq Stock Market LLC under the symbol “EE”.
-
Share Structure:
- Authorized preferred stock: 5,000,000 shares at \$0.01 par value (none issued or outstanding).
- Authorized common stock: 100,000,000 shares at \$0.01 par value.
- Outstanding common shares as of June 30, 2026: 13,769,371 (excluding 3,355,466 treasury shares).
- Treasury shares: 3,355,466, unchanged from December 31, 2025.
-
Balance Sheet Highlights:
- Total Assets as of June 30, 2026: \$855.7 million (down from \$911.6 million as of December 31, 2025).
- Current Assets: \$229.7 million (down from \$299.8 million at year-end 2025).
- Total Shareholders’ Equity: \$286.8 million (down from \$320.8 million at year-end 2025), indicating a notable decrease.
- Treasury Stock Value: \$(266.2) million (unchanged from year-end 2025).
-
Profitability and Performance:
- Net Income (Q2 2026): \$17.3 million.
- Net Loss (Q2 2025, for comparison): \$(12.4) million, showing a substantial turnaround year-over-year.
- Comprehensive Income: Matches net income, indicating no significant other comprehensive income/loss items.
-
Earnings Per Share (EPS):
- Basic EPS (Q2 2026): \$1.93 (up from \$0.65 in Q2 2025 and \$0.69 in Q1 2026).
- Diluted EPS (Q2 2026): \$1.90 (up from \$0.65 in Q2 2025 and \$0.68 in Q1 2026).
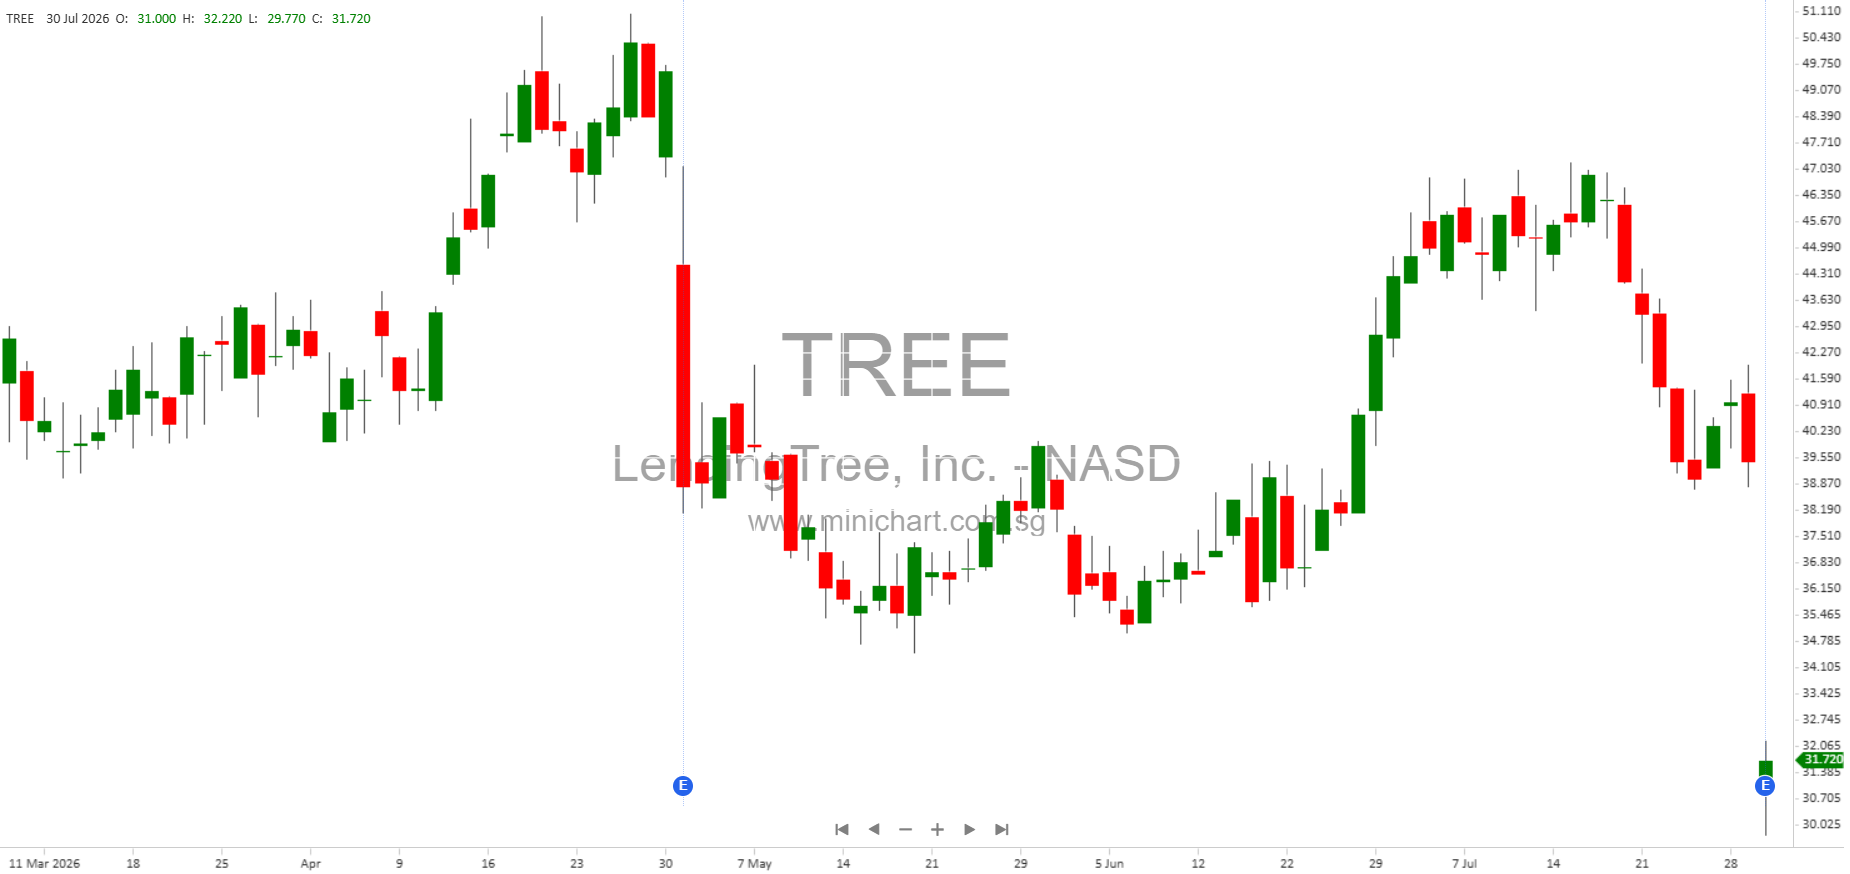
This sharp increase in EPS is a highly price-sensitive metric and may drive positive investor sentiment and potential share price appreciation.
-
Capital Activities:
- No new preferred shares issued.
- Common stock issued during the quarter via option exercises and restricted stock units (net of tax): 82,000 shares, resulting in additional paid-in capital of \$248,000.
-
Share-Based Compensation:
- Share-based compensation recognized in equity for the quarter: \$4.1 million.
-
Operating Metrics:
- Weighted Average Basic Shares Outstanding: 13.9 million for Q2 2026, up from 13.5 million in Q2 2025.
Important Investor Considerations
- Substantial Year-Over-Year Turnaround: The company has delivered a significant improvement in profitability, shifting from a net loss in Q2 2025 to strong net income in Q2 2026. This is reflected in both basic and diluted EPS, which are nearly triple the prior year’s results.
- Shareholder Value: The rise in EPS, coupled with stable share count and no dilution from preferred stock, is likely to be viewed positively by shareholders and could be a catalyst for share price appreciation.
- Balance Sheet Strength: While there is a decrease in total assets and shareholders’ equity, the company’s consistent treasury stock position and improved profitability suggest a focus on efficient capital management.
- Share-Based Compensation: Continued issuance of stock options and restricted stock units is diluting but offset by strong earnings performance.
- No Indication of Emerging Growth Company or Shell Company Status: The company is considered a seasoned issuer, not an emerging growth or shell company, reducing regulatory uncertainty.
Potential Price-Sensitive Information
- EPS Growth: The surge in EPS and return to profitability is likely to be viewed as a strong indicator of management’s successful execution. This is material information for investors and may lead to a re-rating of the company’s share price.
- Stable Capital Structure: No new preferred stock or major dilution events. Treasury shares remain unchanged, suggesting no recent buybacks or issuances that would significantly affect ownership structure.
- Improvement in Comprehensive Income: The transition from loss to profit will be a key point in management’s communication with investors.
Conclusion
LendingTree, Inc.’s Q2 2026 report delivers a compelling narrative for investors, with strong EPS growth, a clear return to profitability, and prudent capital management. The absence of new dilution, consistent treasury stock levels, and robust share-based compensation management support a story of operational discipline. The key price-sensitive takeaway is the dramatic improvement in earnings and profitability, which is likely to influence trading sentiment and attract further investor interest.
Disclaimer: This article is an interpretation of LendingTree, Inc.’s Q2 2026 Form 10-Q based on the information provided and is intended for informational purposes only. It does not constitute investment advice. Please consult your financial advisor before making any investment decisions. All financial figures are based on company-provided SEC filings and may be subject to change or restatement.