AutoNation Reports Q2 2026 Results: Strong EPS Growth, Aggressive Buybacks, Acquisition Activity, and Expanding Finance Arm
Key Highlights from Q2 2026 Earnings Report
- Q2 2026 EPS surges to \$5.39 (Q2 2025: \$2.26), with Adjusted EPS at \$5.56 (Q2 2025: \$5.46).
- Sixth consecutive quarter of Adjusted EPS growth.
- Record After-Sales gross profit, with Customer Pay revenue up 7% year-over-year.
- AutoNation Finance portfolio expands over 50%, with year-to-date profit up tenfold.
- Four dealerships acquired in Atlanta and San Francisco Bay Area, adding scale, brand diversity, and market density (~\$600M annual revenue).
- \$457 million in share repurchases in the first half of 2026, reducing outstanding shares by over 6%.
- Strong cash flow: Adjusted free cash flow of \$439.2 million (125% of adjusted net income).
Financial Performance Summary: Q2 and YTD 2026
- Total revenue (Q2): \$6.93 billion, down 1% YoY.
- Gross profit (Q2): \$1.23 billion, down 3% YoY.
- Operating income (Q2): \$319 million, up 47% YoY.
- Net income (Q2): \$182.1 million, up 111% YoY.
- Diluted EPS (Q2): \$5.39, up 138% YoY.
- Adjusted Operating Income (Q2): \$343.1 million, down 7% YoY.
- Adjusted Net Income (Q2): \$187.8 million, down 10% YoY.
- Adjusted Diluted EPS (Q2): \$5.56, up 2% YoY.
Year-to-date (YTD), revenue reached \$13.48 billion (-1%), gross profit \$2.44 billion (-2%), operating income \$633.3 million (+14%), and net income \$387.5 million (+48%). YTD diluted EPS is \$11.26 (+67%), with Adjusted Diluted EPS at \$10.24 (+1%). Notably, diluted weighted average shares dropped 12% YoY due to buybacks.
Operational Performance and Segment Insights
-
After-Sales and Customer Financial Services
AutoNation achieved record gross profit in After-Sales, with Customer Pay up 7%. Finance and Insurance (F&I) gross profit per vehicle rose 3%. The AutoNation Finance portfolio grew to \$2.7 billion, with YTD profit surging 10x, and interest margin up \$10.7 million in Q2 (Q2 2025: \$2.0 million). -
Dealership Acquisitions
In June 2026, the company acquired a Toyota dealership in Atlanta and three premium luxury stores in the San Francisco Bay Area, adding approximately \$600 million in annual revenue and 9,700 retail new and used vehicle unit sales. -
Share Repurchases
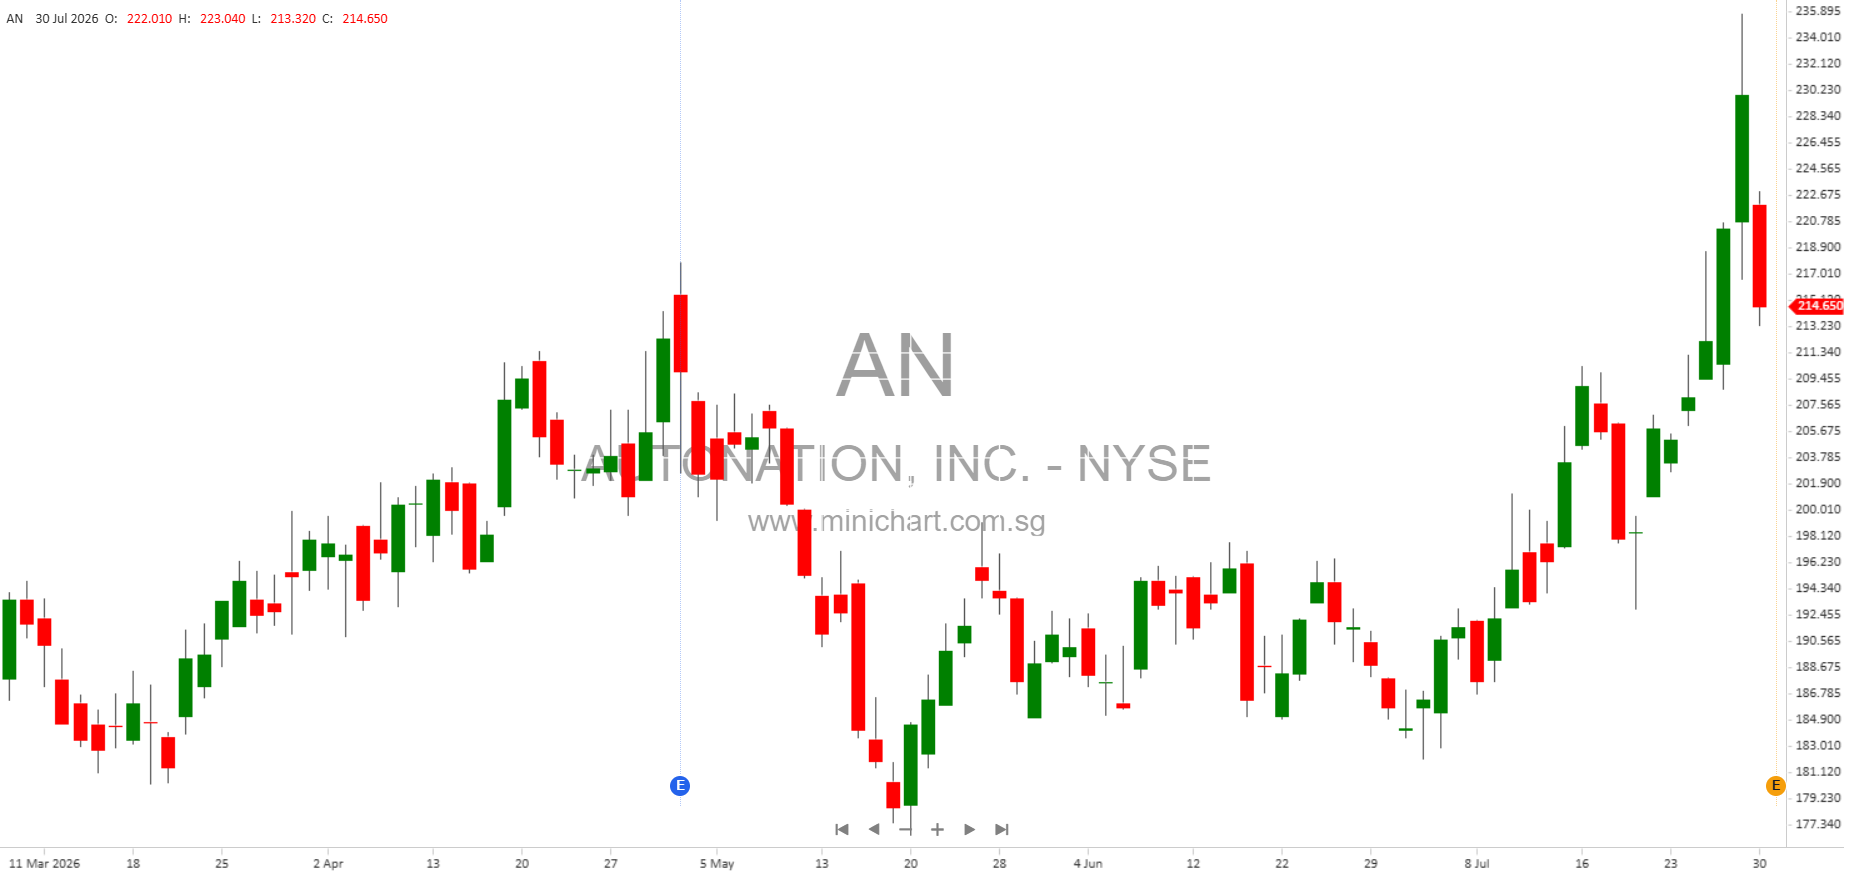
AutoNation bought back 2.3 million shares for \$457 million in H1 2026, at an average price of \$200.59 per share. As of July 29, 2026, the total reached \$470 million. -
Liquidity and Leverage
The company ended Q2 with \$1.0 billion in liquidity (\$53 million in cash, \$900 million in revolver availability), a covenant leverage ratio of 2.8x (2.7x net of cash), and \$4.4 billion in non-vehicle debt.
Same-Store and Segment Data
- Same-Store Revenue and Gross Profit both declined (-2% and -5% YoY for Q2). New and used vehicle retail unit sales fell 5% and 8%, respectively.
- Revenue Mix: New vehicles (47.5%), Used (29.0%), Parts & Service (18.2%), F&I (5.2%) in Q2 2026. Parts & Service accounted for nearly half of total gross profit.
- Gross Profit Per Vehicle: New vehicles \$2,381 (Q2 2025: \$2,785), Used \$1,582 (Q2 2025: \$1,622), F&I \$2,799 (Q2 2025: \$2,712).
- Operating Margins: Operating income as a percentage of revenue rose to 4.6% (Q2 2025: 3.1%).
- Brand Mix: Ford, Lincoln, Chevrolet, Chrysler, Toyota, Honda, Hyundai, Subaru, Mercedes-Benz, BMW, Lexus, Audi, Jaguar Land Rover, and others are included, with import and premium luxury representing nearly 73% of new vehicle sales.
Balance Sheet and Cash Flow
-
Balance Sheet Highlights:
Cash and equivalents: \$53.3 million
Inventory: \$3.74 billion
Floorplan notes payable: \$4.06 billion
Auto loans receivable: \$2.59 billion
Non-recourse debt: \$2.42 billion
Non-vehicle debt: \$4.43 billion
Equity: \$2.26 billion - Days Supply: New vehicles: 53 days, Used: 38 days.
- Free Cash Flow: Adjusted free cash flow was \$439.2 million YTD, representing a 125% conversion of adjusted net income.
Other Noteworthy Items
- Impairments: Q2 2025 included significant impairments (\$65.3 million goodwill, \$71.7 million franchise rights, \$4.3 million other intangibles), not repeated in 2026.
- Capital Expenditures: \$126 million in H1 2026 (down from \$154.2 million in H1 2025).
- Guidance & Outlook: Management emphasized continued focus on cash flow and disciplined capital allocation for shareholder returns.
- Potential Risks: Forward-looking risks highlighted include economic conditions (tariffs, rates, demand), execution of acquisitions, gross margin pressure, cyber risks, manufacturer relationships, regulations, and integration of new businesses.
What Investors Should Watch
- The sharp increase in EPS and net income could attract positive investor sentiment, but the slight revenue and gross profit declines and unit sales drop may temper enthusiasm.
- Buyback activity is significant, with over 6% of shares retired in six months at a premium price, supporting EPS but potentially signaling management sees shares as undervalued or lacking better capital deployment options.
- Acquisition activity in key markets (Atlanta, Bay Area) boosts scale and brand mix, and may drive future revenue and profit growth.
- AutoNation Finance is scaling rapidly, with profit up 10x YTD and portfolio growth exceeding 50%. This could be a major driver of future earnings if credit quality is maintained.
- Parts & Service is a robust profit center, now providing nearly half of all gross profit—an important buffer against vehicle sales cyclicality.
- Leverage ratios remain well within covenant limits, providing financial flexibility.
Conclusion
AutoNation’s Q2 2026 report is notable for its record after-sales profit, surging EPS, substantial buybacks, and aggressive finance portfolio growth, even as top-line revenue and unit sales softened. The company’s strong capital allocation, market expansion via acquisitions, and focus on higher-margin business lines position it well, but investors should monitor for potential margin pressures, macroeconomic risks, and integration challenges.
Disclaimer: This article is for informational purposes only and does not constitute investment advice. Investors should review AutoNation’s full filings and consult their own financial advisors before making investment decisions. Forward-looking statements are subject to risks and uncertainties as described in AutoNation’s SEC filings.