O’Reilly Automotive Reports Record Q2 2026 Results, Raises Full-Year Guidance
Key Points Investors Should Know
- Record Second Quarter Results: O’Reilly Automotive, Inc. (Nasdaq: ORLY) delivered record revenue and earnings for Q2 2026, with sales rising 8% to \$4.89 billion. Comparable store sales grew 6.0% year-over-year, outperforming the prior year’s 4.1% growth.
- Earnings Growth: Net income for the quarter increased 7% to \$715 million, while diluted earnings per share (EPS) jumped 10% to \$0.86. For the first half of 2026, net income rose 9% to \$1.32 billion and diluted EPS surged 13% to \$1.58.
- Share Repurchase Program: O’Reilly repurchased \$2.43 billion of its own shares in H1 2026, including \$1.51 billion in Q2 alone. The company has now repurchased 1.5 billion shares since 2011, for a cumulative \$30.42 billion, with \$1.33 billion remaining under the current authorization.
- Raised Full-Year Guidance: Management increased 2026 comparable store sales growth guidance to 4.0%–6.0% (up from prior outlook). Full-year revenue is now expected in the range of \$18.9–\$19.2 billion, with EPS guidance raised to \$3.20–\$3.30.
- Strong Store Expansion: 110 net new stores opened year-to-date, keeping the company on track to open 225–235 new stores in 2026. As of June 30, 2026, O’Reilly operated 6,695 stores across the U.S., Puerto Rico, Mexico, and Canada.
- Healthy Margins and Free Cash Flow: Gross profit margin remained robust at 51.4% in Q2, and operating income held steady at 20.2% of sales. The company generated \$1.48 billion in free cash flow in the first half of 2026.
- Balance Sheet and Leverage: Adjusted debt to EBITDAR ratio was 2.17x at June 30, 2026, up from 2.06x a year earlier, reflecting increased leverage from substantial share repurchases and debt issuance.
Detailed Financial Performance
Second Quarter 2026
- Sales increased to \$4.89 billion from \$4.53 billion.
- Gross profit was \$2.52 billion (51.4% of sales), up from \$2.33 billion (also 51.4%).
- Selling, general, and administrative expenses (SG&A) rose 8% to \$1.53 billion (31.3% of sales).
- Operating income increased 8% to \$986 million (20.2% of sales).
- Net income grew 7% to \$715 million (14.6% of sales).
- Diluted EPS increased 10% to \$0.86, on a lower share count (829 million shares vs. 858 million a year ago).
First Half 2026 (Year-to-Date)
- Sales climbed 9% to \$9.45 billion.
- Gross profit grew 9% to \$4.86 billion (51.5% of sales).
- SG&A expenses were \$3.04 billion (32.1% of sales).
- Operating income rose 10% to \$1.83 billion (19.3% of sales).
- Net income increased 9% to \$1.32 billion (14.0% of sales).
- Diluted EPS was \$1.58, up 13% from \$1.40 Y/Y.
- Free cash flow for H1 was \$1.48 billion.
Share Repurchase and Capital Allocation
- Repurchased 16.7 million shares in Q2 at an average of \$90.40/share (\$1.51 billion), and 26.7 million shares YTD at \$91.17/share (\$2.43 billion).
- Since the end of Q2 and through the press release date, an additional 7.3 million shares were bought at an average \$86.81/share, totaling \$632 million.
- Total share repurchases since 2011 amount to 1.50 billion shares for \$30.42 billion (average \$20.32/share).
- As of the release date, \$1.33 billion remains under the current repurchase authorization, which could continue to support EPS and the stock price.
Updated 2026 Guidance (as of July 29, 2026)
| Metric | 2026 Guidance |
|---|---|
| Net new store openings | 225 to 235 |
| Comparable store sales growth | 4.0% to 6.0% |
| Total revenue | \$18.9B to \$19.2B |
| Gross profit margin | 51.5% to 52.0% |
| Operating income margin | 19.3% to 19.8% |
| Effective tax rate | 22.5% |
| Diluted earnings per share | \$3.20 to \$3.30 |
| Net cash from operating activities | \$3.1B to \$3.5B |
| Capital expenditures | \$1.3B to \$1.4B |
| Free cash flow | \$1.8B to \$2.1B |
(Note: Guidance incorporates the impact of share repurchases completed to date in the EPS calculation.)
Operational Highlights
- As of June 30, 2026, O’Reilly operated 6,695 stores: 6,541 in the U.S., 126 in Mexico, and 28 in Canada.
- Store count increased by 110 net new stores year-to-date, with no store closures.
- Total employment stands at 95,822, up from 92,810 a year ago.
- Sales per weighted-average store for the trailing twelve months reached \$2.81 million, up from \$2.67 million last year.
- Inventory turnover remains steady at 1.6x, and accounts payable to inventory ratio was 123.7% (a slight decline from 127.0%).
Additional Items of Interest to Shareholders
- Leverage Increase: The adjusted debt to EBITDAR ratio rose to 2.17x from 2.06x, reflecting the company’s aggressive capital return policy.
- Tax Impact on Buybacks: Excise tax on share repurchases was \$24.3 million for the first half of the year.
- Strong Cash Position: Cash and equivalents increased to \$262 million at June 30, 2026, up from \$194 million at the end of 2025.
- Conference Call Details: The company will host an earnings call on July 30, 2026, at 10:00 a.m. Central Time, accessible via O’Reilly’s investor relations website and by phone.
Potential Share Price Movers
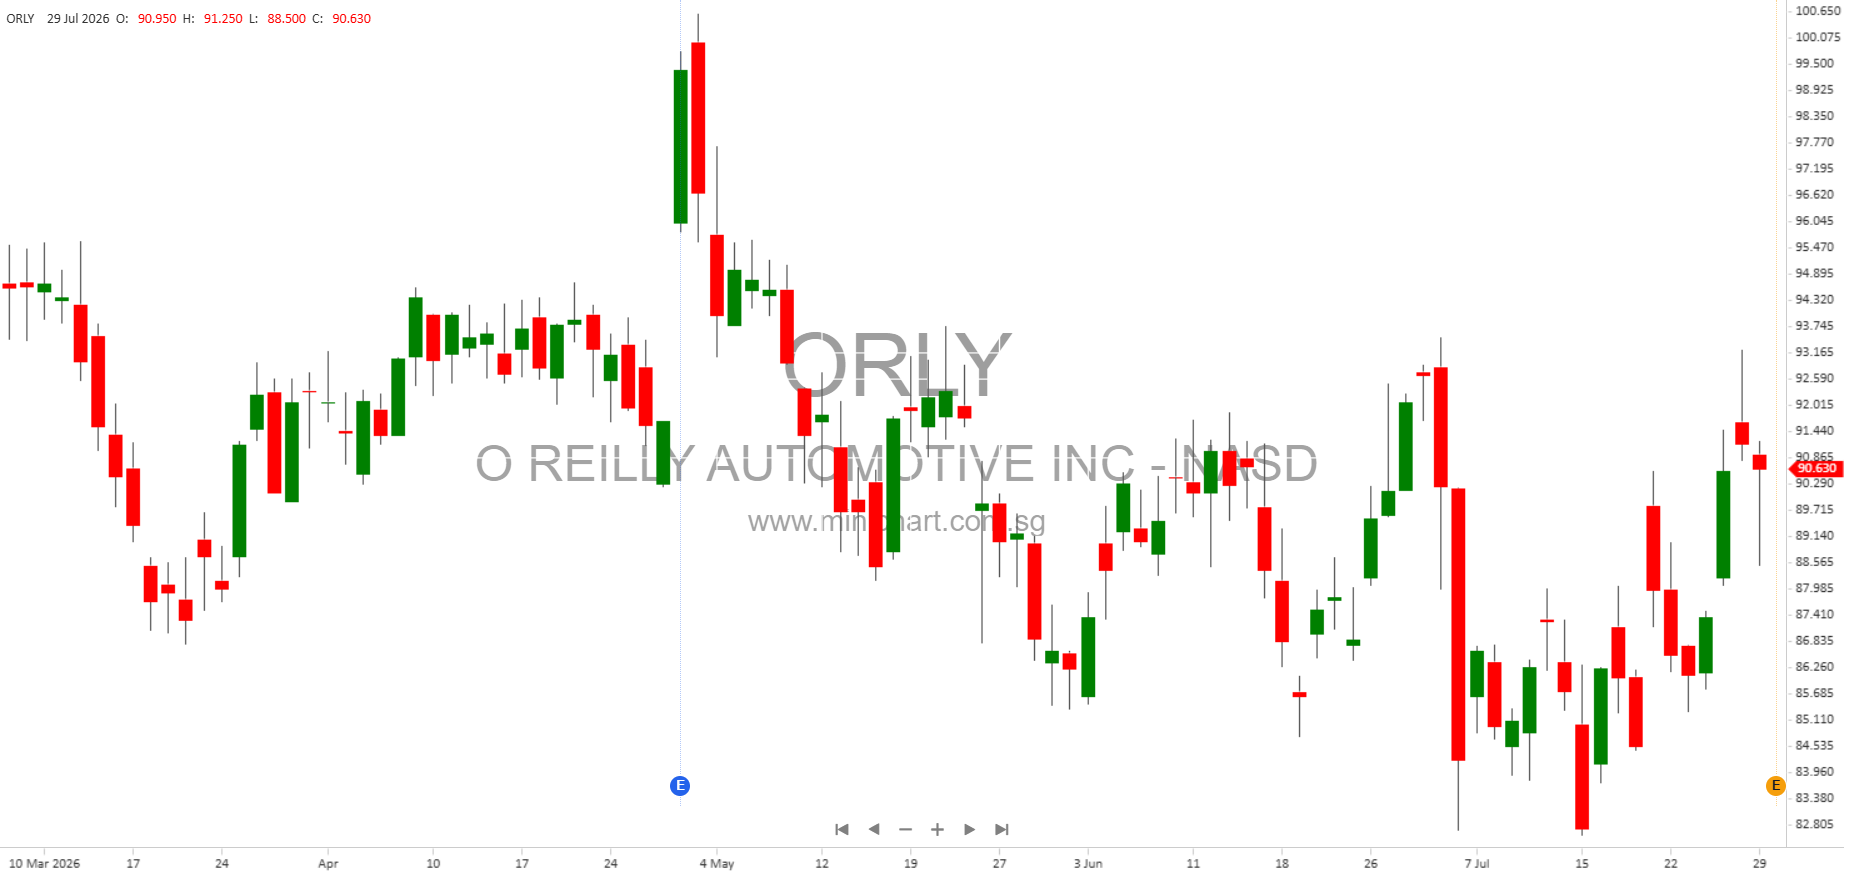
- Raised Guidance: Upward revision in comparable store sales and EPS guidance is a positive catalyst for the stock.
- Robust Share Repurchase: Continued aggressive buybacks may further support EPS growth and the share price.
- Solid Execution: Consistent operating margins and growth in both professional and DIY segments demonstrate strong management execution.
- Store Expansion: Accelerated store openings and expansion into Mexico and Canada may drive future growth.
- Leverage Trend: Increasing leverage from debt-funded buybacks could attract both positive and cautious investor attention.
About O’Reilly Automotive, Inc.
Founded in 1957, O’Reilly Automotive is one of the largest specialty retailers of automotive aftermarket parts, tools, supplies, equipment, and accessories in North America. The company serves both the do-it-yourself and professional service provider markets. For more information, visit www.OReillyAuto.com.
Disclaimer
This article is for informational purposes only and does not constitute investment advice. Financial results, forward-looking statements, and guidance are subject to risks and uncertainties as described in O’Reilly Automotive’s filings with the SEC. Actual results may differ materially from those expressed or implied herein. Investors should review official company announcements and regulatory filings before making investment decisions.