Markel Group Inc. Reports Strong Q2 2026 Earnings: Key Highlights for Investors
Overview
Markel Group Inc. (NYSE: MKL) has released its unaudited financial results for the second quarter ended June 30, 2026. The report reveals robust performance across core insurance operations, investments, and product revenues, while also providing insights into the company’s balance sheet strength and capital position. Below, we break down the most important information for shareholders and potential investors.
Key Financial Highlights
- Total Assets: \$71.26 billion as of June 30, 2026, up from \$68.91 billion at December 31, 2025.
- Total Investments: \$33.50 billion, up from \$32.84 billion at year-end 2025.
- Shareholders’ Equity: \$19.00 billion, up from \$18.60 billion at December 31, 2025.
- Quarterly Net Premiums Earned: \$2.07 billion (Q2 2026), compared to \$2.14 billion (Q2 2025).
- Net Investment Income: \$256 million (Q2 2026), up from \$230 million (Q2 2025).
- Net Investment Gains: \$1.17 billion (Q2 2026), a dramatic increase from \$580 million in Q2 2025.
- Operating Revenues: \$4.02 billion (Q2 2026), with six months’ total at \$7.57 billion, nearly flat compared to the prior year.
- Operating Income: \$1.56 billion (Q2 2026), up from \$1.11 billion (Q2 2025).
- Common Shares Outstanding: 12,389,958 shares as of July 22, 2026.
Segment Performance and Revenue Drivers
-
Insurance Operations:
- Net earned premiums saw a slight decrease year-over-year, but the insurance business remains the biggest contributor to revenue.
- Underwriting, acquisition, and insurance expenses remained stable, indicating disciplined cost management.
-
Investments:
- Significant net investment gains (\$1.17 billion in Q2) reflect strong performance in equity and fixed income holdings, possibly benefiting from favorable market conditions.
- Net investment income also rose, suggesting prudent asset allocation and yield optimization.
-
Products and Services:
- Product revenues contributed \$859 million in Q2, stable compared to prior periods and confirming the diversified revenue streams beyond insurance.
Balance Sheet and Capital Position
-
Assets:
- Large, high-quality investment portfolio anchored by \$17.80 billion in fixed maturity securities and \$13.46 billion in equity securities at fair value.
- Short-term investments and cash reserves remain robust, supporting liquidity.
-
Liabilities:
- Total liabilities at \$49.80 billion, including prudent reserves for unpaid losses and loss adjustment expenses.
- Redeemable noncontrolling interests increased to \$506 million from \$467 million at year-end.
-
Equity:
- Shareholders’ equity continues to rise, reflecting retained earnings growth and investment gains.
- Book value per share has likely improved, enhancing intrinsic value for investors (exact figure not specified, but inferred from data).
Potential Price-Sensitive and Shareholder-Important Information
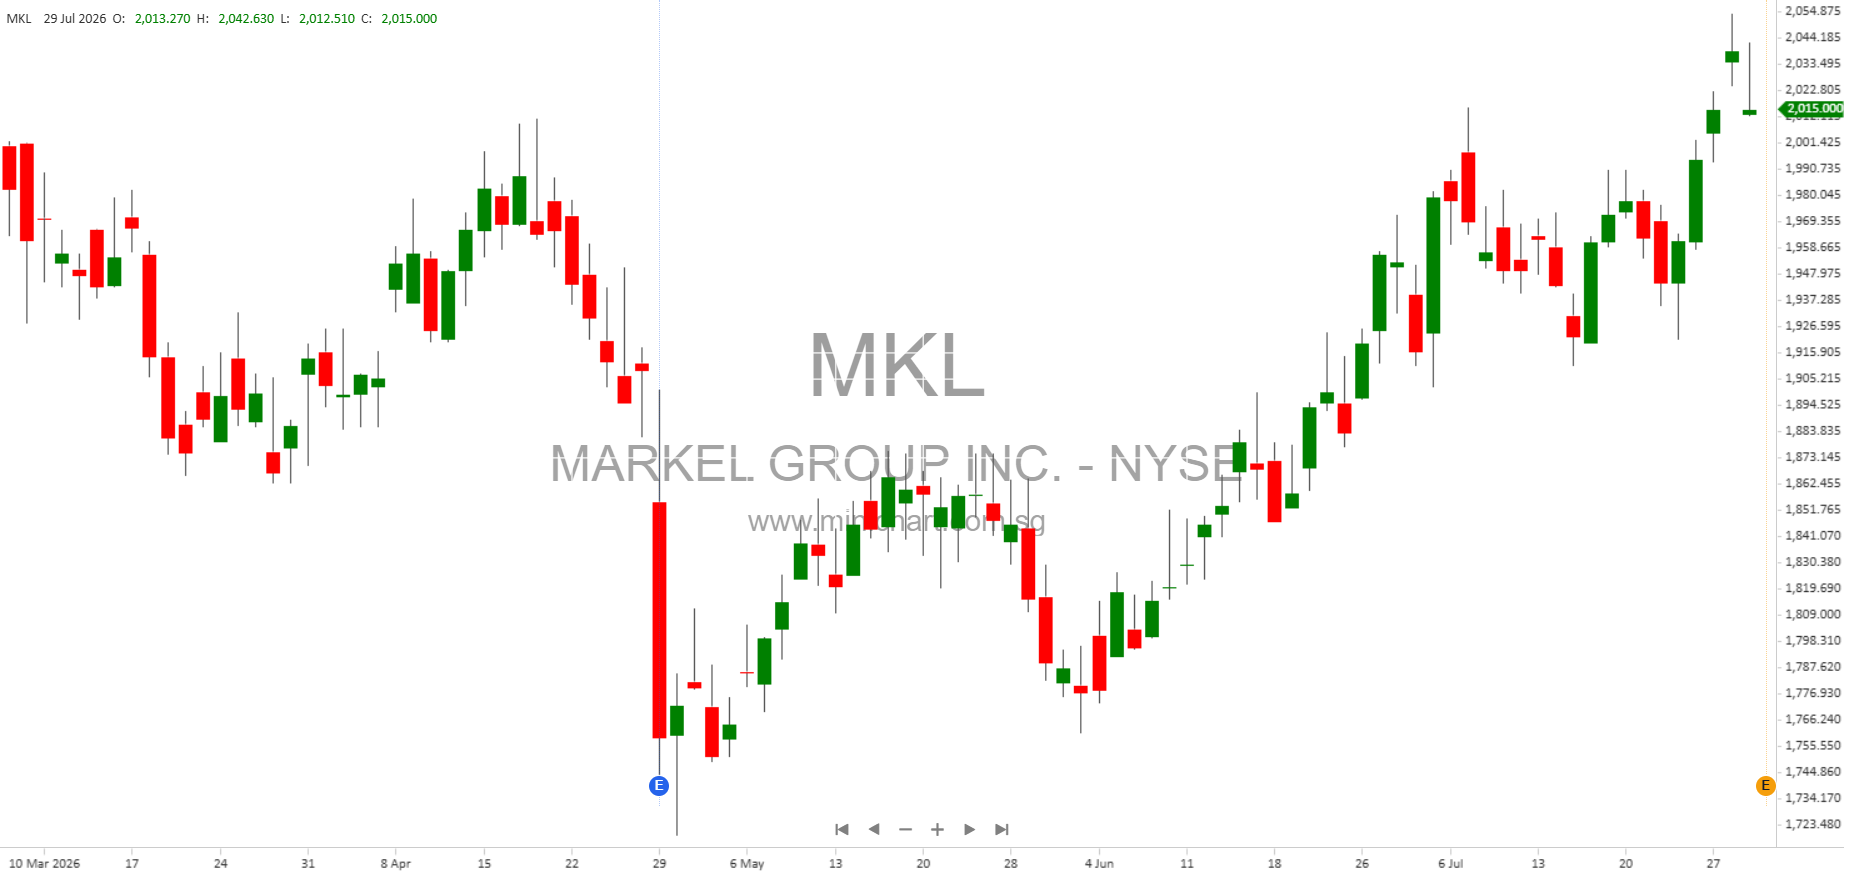
- Exceptional Investment Gains: The \$1.17 billion quarterly net investment gain is a standout result and could be a major driver of share price appreciation. This performance outpaces both the prior quarter and year, suggesting Markel’s investment strategy is delivering outsized returns in the current market.
- Balance Sheet Strength: The continued growth in total assets and equity, coupled with a stable liability profile, positions Markel well for future growth, capital deployment, and possible share buybacks or dividends. Investors may interpret this as a sign of financial resilience.
- Share Count: The company reported 12,389,958 shares outstanding, which is relevant for per-share calculations and potential buyback impact.
- No Indication of Emerging Growth or Shell Status: Markel is classified as a “large accelerated filer” and is not an emerging growth or shell company, indicating regulatory stability.
- Flat Premium Growth: The slight year-over-year decline in earned premiums may raise questions about growth in the insurance segment, but is offset by investment performance.
- Shareholder Equity Growth: Book value and total equity are up, which is typically viewed positively by long-term investors.
Conclusion
Markel Group Inc. delivered a strong quarter with exceptional net investment gains and growing shareholders’ equity. While insurance premium revenue was slightly down, the company’s diversified business model and robust investment performance more than compensated. The balance sheet remains solid, positioning Markel for continued resilience and flexibility.
Shareholders should pay close attention to the outsized investment results, as they may drive share price momentum in the near term. Any sustained ability to deliver such returns could result in further upward pressure on Markel’s valuation.
Disclaimer: This article is intended for informational purposes only and does not constitute investment advice. Investors should review the full SEC filing and consult with a financial advisor before making any investment decisions. Financial results are unaudited and subject to revision.