Kite Realty Group Trust Reports Strong Q2 2026 Results and Issues Updated Guidance
Key Highlights from the Q2 2026 Investor Update
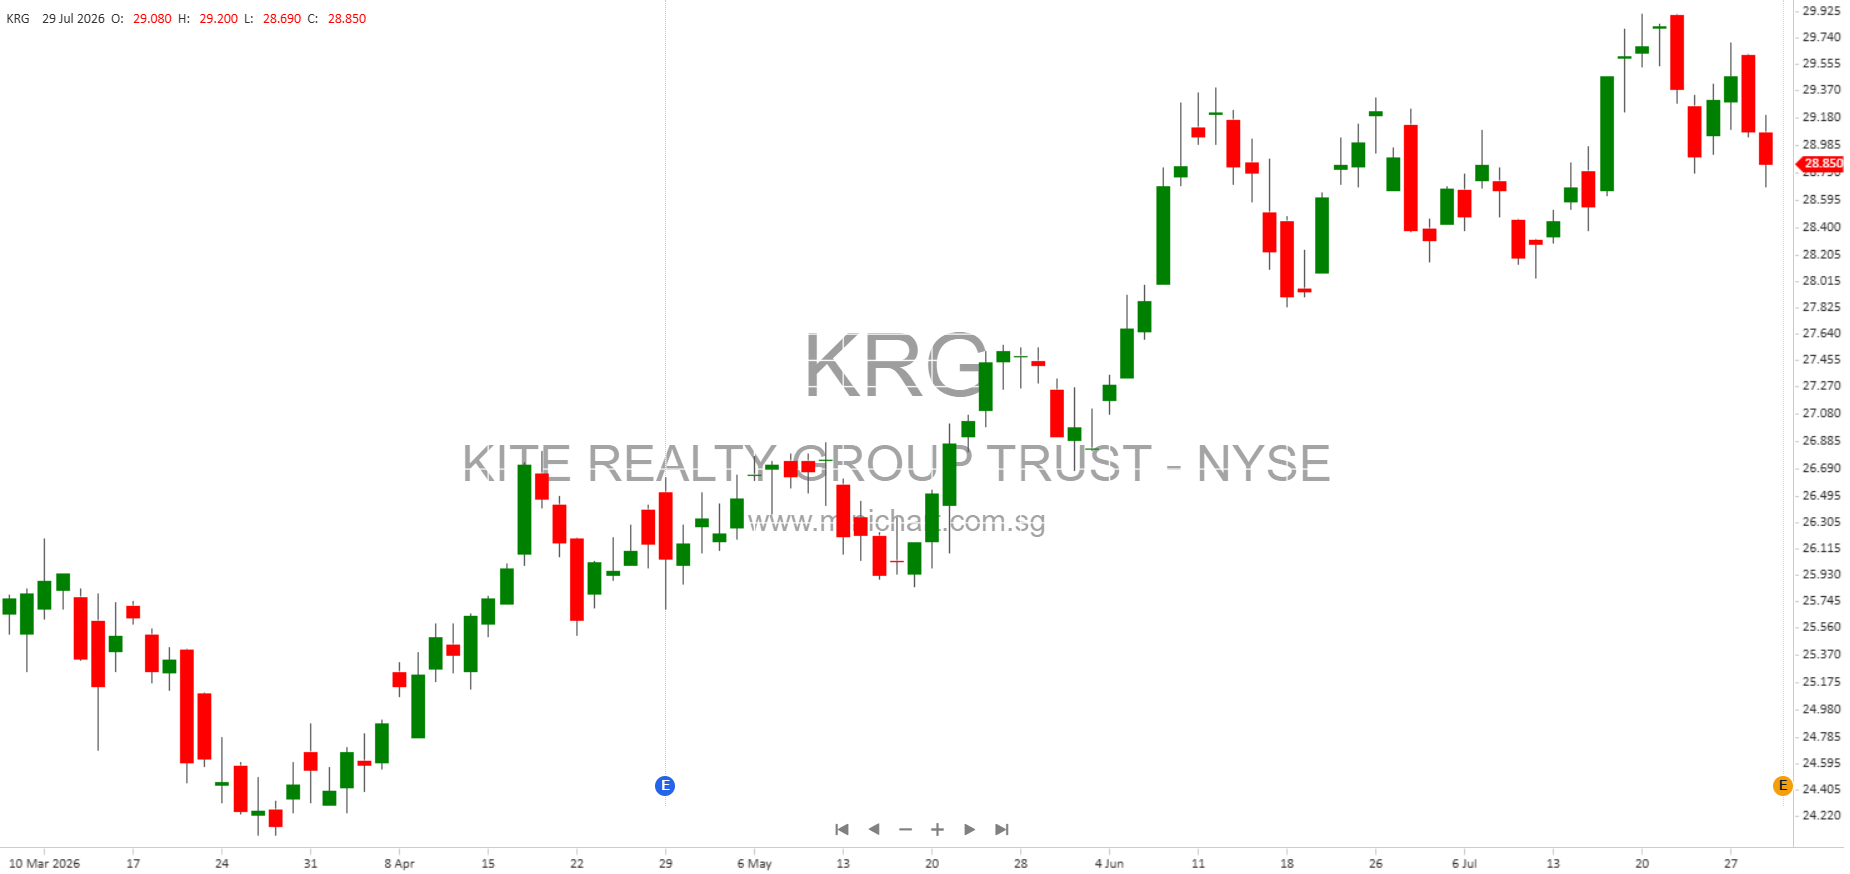
Kite Realty Group Trust (NYSE: KRG) has released its Q2 2026 Investor Update, reporting robust financial and operating results and providing updated guidance for the full year. The company’s performance, strategic portfolio positioning, and balance sheet management present a positive outlook for shareholders and could have significant implications for the share price.
Financial and Operating Performance
- NAREIT Funds From Operations (FFO): \$0.53 per share for Q2 2026, driven by strong same-property Net Operating Income (NOI) growth. Core FFO stands at \$0.52 per share.
- Same Property NOI Growth: 3.7%, supported by increases in base rent, favorable leasing spreads, and higher occupancy rates.
- Total Leasing Volume: Approximately 1 million square feet, with blended cash leasing spreads at a robust 15.9%.
- Occupancy Metrics:
- Anchor leased percentage: 96.3% (up 210 basis points year-over-year)
- Small shop leased percentage: 92.3% (up 70 basis points year-over-year)
- Leased-to-Occupied Spread: 350 basis points at period-end, representing \$37.3 million of NOI, with ~43% expected to come online in 2026.
- Average Base Rent (ABR) per Square Foot: Continued growth, reflecting a 4.5% compound annual growth rate (CAGR) from 2017 to 2026.
- Net Debt to Adjusted EBITDA: 5.1x, indicating prudent leverage management.
2026 Guidance
- NAREIT and Core FFO Guidance: Both set at \$2.06 – \$2.12 per share for 2026, reaffirming management’s outlook.
- Key Assumptions:
- Same-property NOI growth range: 3.00% to 4.00%
- Bad debt reserve: 0.90% of total revenues at the midpoint
- Net interest expense: \$114.7 million at the midpoint, inclusive of recent joint venture deconsolidations
Portfolio and Leasing Strategy
- Portfolio Mix: Concentrated in Sun Belt markets (66% ABR), with top states including Texas (27%), Florida (12%), and Virginia (8%).
- Asset Types: Focus on grocery-anchored centers, mixed-use, and lifestyle assets. Embedded rent growth and high-quality tenant mix are emphasized.
- Leasing Activity: Aggressive pursuit of higher fixed rent bumps in new and renewal leases, with 86% of new leases and renewals in 2026 featuring fixed rent bumps of 3% or more.
- Anchor Leasing: 61 anchor leases executed since 2024, covering 1.48 million square feet, generating a 28% cash lease spread and \$38 million in new NOI. The return on capital invested in anchor repositioning is estimated at 30%.
Balance Sheet Strength and Capital Management
- Liquidity: \$1.2 billion available; minimal near-term capital commitments.
- Credit Ratings: Maintains investment-grade ratings (S&P: BBB; Moody’s: Baa2), reflecting financial stability.
- Debt Maturity Ladder: Well-staggered maturity profile. Proceeds from a recent \$345 million exchangeable notes issuance and asset sales will be used to repay or redeem \$400 million of remaining 2026 unsecured debt maturities, reducing refinancing risk.
- Unencumbered NOI: 89% of total NOI, providing flexibility and further supporting the investment-grade balance sheet.
Market and Industry Context
- Open-Air Retail Trends: The U.S. is experiencing record-high leased rates for open-air retail due to over 15 years of limited new supply, driving landlord pricing power and strong tenant demand.
- Tenant Base: Highly diversified and durable, with top categories including discount retailers, grocery, wine/spirits, fitness, electronics, and restaurants. The anchor/shop split has shifted toward a higher mix of lifestyle and mixed-use centers.
Risks and Forward-Looking Statements
The company highlights potential risks, including macroeconomic uncertainty (interest rates, inflation, consumer spending), refinancing risks, competitive pressures, property and tenant risks, geographic concentration, regulatory changes, and external events (e.g., natural disasters, cyber-attacks, AI adoption). Investors are advised to review the “Risk Factors” in the latest 10-K and subsequent filings.
Analysis and Price-Sensitive Considerations
- Positive:
- Sustained NOI and FFO growth, strong leasing spreads, and robust occupancy metrics indicate continued operational strength.
- Effective capital allocation (debt reduction, liquidity management) and a resilient balance sheet lower financial risk and support dividend stability.
- Concentration in high-growth Sun Belt markets and proactive leasing strategies enhance long-term value creation.
- Potential Concerns:
- Macro risks could impact tenant health and rent collection, though current bad debt reserves appear conservative.
- Execution risk on re-leasing and redevelopment activities, particularly in a dynamic retail environment.
Conclusion
The combination of strong Q2 financial results, reaffirmed guidance, active portfolio management, and a well-managed balance sheet are materially positive for shareholders. The company’s ongoing ability to drive NOI and FFO growth, sustain high occupancy, and proactively manage debt maturities supports a bullish thesis on the stock. However, external risks remain and should be monitored.
Disclaimer: This article is a summary and analysis of public disclosures from Kite Realty Group Trust as of Q2 2026. It is intended for informational purposes only and does not constitute investment advice. Investors should consult the company’s official filings and their own advisors before making investment decisions. Past performance is not indicative of future results, and actual outcomes may differ materially from forward-looking statements.