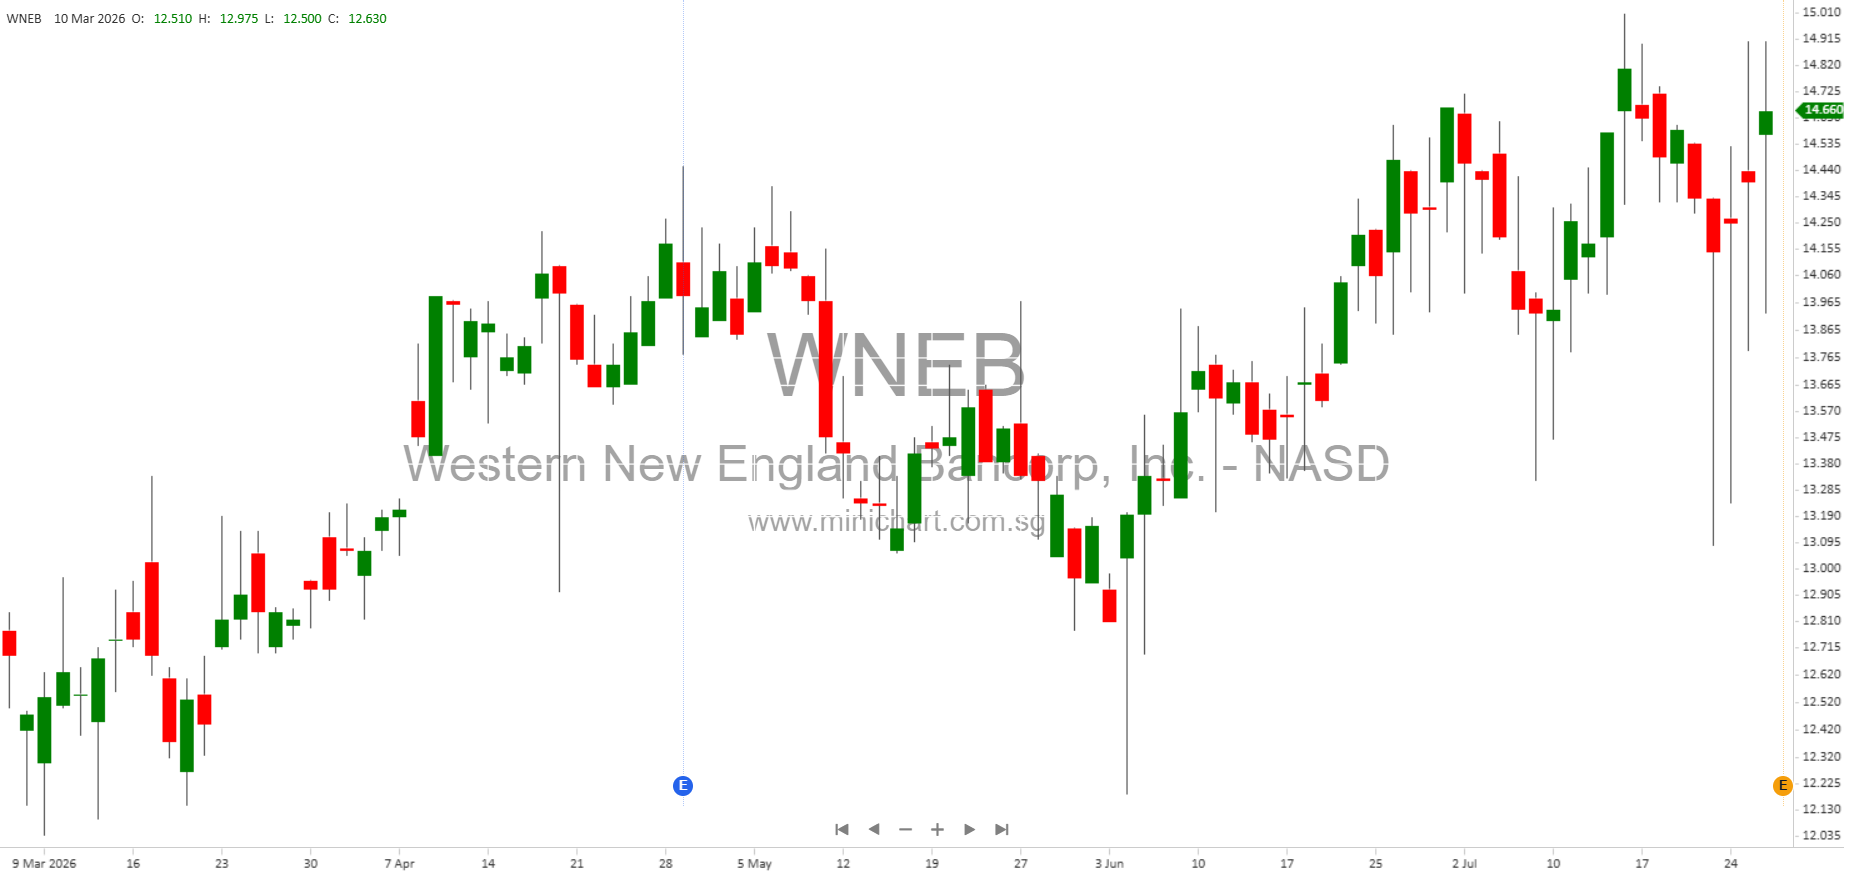
Western New England Bancorp, Inc. Q2 2026 Financial Report: In-Depth Analysis for Investors
Summary of Financial Results
- Net Income: For the three months ended June 30, 2026, Western New England Bancorp, Inc. (“WNEB”) reported net income of \$3.6 million (\$0.18 per diluted share), down from \$4.6 million (\$0.23 per diluted share) in Q2 2025 and \$4.8 million (\$0.24 per diluted share) in Q1 2026. For the six months ended June 30, 2026, net income was \$8.4 million (\$0.42 per diluted share), up from \$6.9 million (\$0.34 per diluted share) for the same period in 2025.
- Dividend: The Board declared a quarterly cash dividend of \$0.07 per share, payable on August 26, 2026, to shareholders of record as of August 12, 2026.
Key Operational Highlights
- Net Interest Margin: Improved to 3.00% in Q2 2026 from 2.95% in Q1 2026 and 2.80% in Q2 2025. On a tax-equivalent basis, NIM rose to 3.02% in Q2 2026.
- Core Deposits: Represented 69.4% of total deposits; non-interest bearing deposits comprised 25.0%. Average cost of deposits was 1.74%.
- Loan Growth: Total loans rose \$9.9 million (0.5%) since December 2025, primarily driven by residential real estate loans (+\$31.7 million, 3.7%) and commercial & industrial loans (+\$12.5 million, 5.6%). Commercial real estate loans decreased by \$33.7 million (3.1%).
- Deposit Growth: Total deposits increased \$40.5 million (1.7%) since December 2025, mainly due to time deposits (+\$45.8 million, 6.6%).
Asset Quality and Credit Risk
- Allowance for Credit Losses: Stood at \$20.2 million (0.92% of total loans), slightly down from \$20.3 million (0.93%) in December 2025.
- Nonaccrual Loans: Increased to \$7.8 million (0.35% of total loans) from \$5.2 million (0.24%) in December 2025.
- Total Delinquent Loans: Rose to \$4.7 million (0.21% of total loans), up from \$3.1 million (0.14%) in December 2025. Notably, 95.1% of these are residential real estate loans.
- Charge-Off Event: A partial charge-off of \$1.8 million was recorded on a non-owner occupied commercial real estate participation loan due to the borrower’s Chapter 11 bankruptcy filing. The remaining value (\$1.6 million) is expected to be recovered from collateral sale.
- Net Charge-Offs: \$1.8 million (0.33% of average loans, annualized) in Q2 2026, compared to net recoveries of \$585,000 (0.11%) in Q2 2025.
- Total Criticized Loans: Increased to \$63.9 million (2.9% of total loans), up from \$39.7 million (1.8%) in December 2025. The rise was due to downgrades of two commercial relationships and the troubled participation loan.
Capital Management and Shareholder Returns
- Share Repurchases: 381,000 shares repurchased in the first half of 2026 at an average price of \$13.64; 491,465 shares remain available under the 2025 Repurchase Plan.
- Book Value Per Share: \$12.39 at June 30, 2026, up from \$12.16 at December 31, 2025.
- Tangible Book Value Per Share (Non-GAAP): \$11.72 at June 30, 2026, up from \$11.49 at December 31, 2025.
- Regulatory Capital: Total capital ratios remain robust and above regulatory “well-capitalized” minimums. Total capital ratio at the Company was 13.96%, Tier 1 at 12.20%, and Tier 1 leverage at 9.18%.
Other Significant Events
- Building Sale: On July 10, 2026, WNEB sold two Chicopee, MA buildings for \$2.4 million, resulting in an estimated gain of \$717,000 to be recognized in Q3 2026. Staff were reassigned, expected to improve operational efficiency.
- Investment Portfolio: At June 30, 2026, the investment securities portfolio totaled \$353.0 million (12.9% of total assets), with net unrealized losses on available-for-sale (\$22.9 million, 11.8%) and held-to-maturity securities (\$30.5 million, 16.8%), reflecting interest rate changes rather than credit impairment.
- Borrowings: Total borrowings decreased significantly (-\$43.5 million, or -41%) since December 2025. Short-term borrowings rose (\$4.5 million), long-term borrowings fell (\$48 million).
- Subordinated Debt: \$19.8 million in fixed-to-floating rate notes, convertible in May 2026 to a floating rate (SOFR + 412 bps).
Performance Ratios and Additional Metrics
- Return on Average Assets: 0.53% for Q2 2026, 0.62% for H1 2026.
- Return on Average Equity: 5.84% for Q2 2026, 6.80% for H1 2026.
- Efficiency Ratio: 72.0% for Q2 2026 (GAAP), improved from 74.4% in Q2 2025. Adjusted efficiency ratio (non-GAAP) was 72.2% vs. 75.3% in Q2 2025.
Potentially Price-Sensitive Developments
- Profit Decline: Net income fell year-over-year and quarter-over-quarter, primarily due to a substantial credit loss provision and charge-off related to a commercial real estate loan.
- Increase in Nonaccrual Loans and Criticized Loans: Indicates emerging credit risk, especially in commercial and industrial loans and commercial real estate portfolio.
- Share Repurchases and Building Sale: Capital management actions, including significant share buybacks and asset sale, may impact future EPS and operational efficiency.
- Dividend Maintained: Despite profit pressures, the dividend was maintained at \$0.07 per share, signaling management confidence in capital strength.
- Regulatory Capital Ratios: Remain strong, supporting ongoing dividend payments and share repurchases.
- Loan Portfolio Shifts: Growth in residential loans and C&I, decrease in commercial real estate, which may reflect strategic risk management in response to market conditions.
- Interest Margin Improvement: NIM rose despite higher funding costs, pointing to effective asset-liability management.
Forward-Looking Statements
Management continues to monitor macroeconomic risks including interest rate increases, inflation, tariffs, and potential economic downturns. The company expects full recovery on the impaired participation loan but remains vigilant regarding commercial real estate values and credit quality trends. Further share repurchases, dividend payments, and loan growth are anticipated, subject to market conditions, regulatory requirements, and ongoing capital planning.
Conclusion
Investors should closely monitor:
- Emerging credit risk in commercial real estate and industrial loan portfolios.
- Impact of the \$1.8 million charge-off and rising criticized loans on future earnings.
- Ongoing capital management strategies, including share repurchases and dividend policies.
- Asset quality metrics and further developments in nonaccrual loans.
While WNEB remains well-capitalized and management is taking proactive steps, recent profit declines and credit charge-offs may be price-sensitive and affect share value. The sale of assets and commitment to shareholder returns (via dividends and buybacks) provide some offsetting positives.
Disclaimer: This article is for informational purposes only and does not constitute investment advice. The information is based on unaudited financial statements and management commentary from Western New England Bancorp, Inc. Investors are advised to conduct their own due diligence and consult with financial advisors before making investment decisions. Forward-looking statements are subject to risks and uncertainties that may cause actual results to differ materially.