WM Delivers Robust Q2 2026 Results with Strong Cash Flow, Margin Gains, and Strategic Investments
Key Highlights from Second Quarter 2026 Results
- Revenue: WM reported Q2 2026 revenues of \$6.684 billion, a 4.0% increase from \$6.430 billion in Q2 2025. Growth was driven by core price increases of 5.7% and a 3.6% yield in the Collection and Disposal segment, as well as higher volumes in recycling and renewable energy businesses from recently completed growth projects and higher energy surcharges.
-
Income & Margins:
- Income from operations rose to \$1.253 billion (\$1.290 billion adjusted) from \$1.151 billion (\$1.215 billion adjusted) a year ago.
- Operating EBITDA climbed to \$2.03 billion (\$2.067 billion adjusted) versus \$1.895 billion (\$1.959 billion adjusted) last year.
- Operating EBITDA margin improved to 30.4% (30.9% adjusted) from 29.5% (30.5% adjusted) in Q2 2025, marking an expansion of 90 basis points (bps), or 40 bps on an adjusted basis, despite 100 bps of headwinds from prior-year wildfire clean-up and energy surcharges.
- Net income attributable to WM increased to \$785 million (\$813 million adjusted) from \$726 million (\$777 million adjusted).
- Diluted EPS was \$1.95 (\$2.02 adjusted) versus \$1.80 (\$1.92 adjusted) a year ago.
- Cash Flow: Cash flow from operations surged nearly 12%, with net cash provided by operating activities reaching \$1.73 billion (Q2 2025: \$1.55 billion). Free cash flow was \$1.10 billion, a 34.5% increase year-over-year, supporting shareholder returns and strategic investments.
- Shareholder Returns: WM returned over \$1.04 billion to shareholders in Q2 2026, with \$659 million in share repurchases and \$379 million in cash dividends.
-
Strategic and Sustainability Initiatives:
- Completed three new renewable natural gas (RNG) facilities (two in South Carolina, one in Florida) adding 3.5 million MMBtu of expected annual run-rate production.
- Completed a new recycling facility in Denver, Colorado, expanding annual processing capacity by 60,000 tons.
- Released the 2026 Sustainability Report, detailing progress toward environmental goals and the value creation from sustainability projects.
-
Operational Efficiencies:
- Operating expenses as a percentage of revenue remained stable at 59.2% despite higher fuel costs, reflecting technology and automation investments to drive efficiency.
- SG&A expenses improved to 10.2% of revenue (9.9% adjusted), down 60 bps from the previous year, due to cost discipline and synergy capture from the Healthcare Solutions segment.
- Collection and Disposal EBITDA grew by \$104 million (\$79 million adjusted) despite a 70 bps headwind from prior-year wildfire contributions.
- Recycling and renewable energy EBITDA increased by \$39 million (\$40 million adjusted, up 32.5% year-over-year) due to higher recycling volumes, automation efficiencies, and increased RNG production.
- Healthcare Solutions EBITDA grew by \$25 million (\$11 million adjusted), reflecting SG&A control and operational integration.
-
Segment Performance:
- Collection and Disposal volume declined 1.8% (down 0.4% excluding prior-year wildfire cleanup), but landfill volumes grew 1.7%. Residential losses have slowed, improving sequentially by 210 bps.
- Internalization of waste based on disposal costs rose to 73.0% from 71.9% a year ago, supporting margin gains.
2026 Outlook and Guidance Update
-
Full-Year Guidance:
- Adjusted operating EBITDA projected between \$8.15–\$8.25 billion.
- Free cash flow expected between \$3.75–\$3.85 billion.
- Revenue now anticipated between \$26.275–\$26.475 billion (a 0.6% reduction from prior outlook, reflecting lower volume assumptions, partially offset by higher energy surcharges).
- Adjusted operating EBITDA margin is now expected at 31.0%–31.2% (up 20 bps).
- Management Commentary: CEO Jim Fish highlighted the company’s ability to deliver strong growth and margin expansion, even in the face of challenging comparisons due to last year’s wildfire clean-up. He emphasized the benefits from investments in technology, automation, and sustainability, and underscored WM’s strong balance sheet and asset network as keys to long-term shareholder value.
-
Shareholder-Impacting Risks and Opportunities:
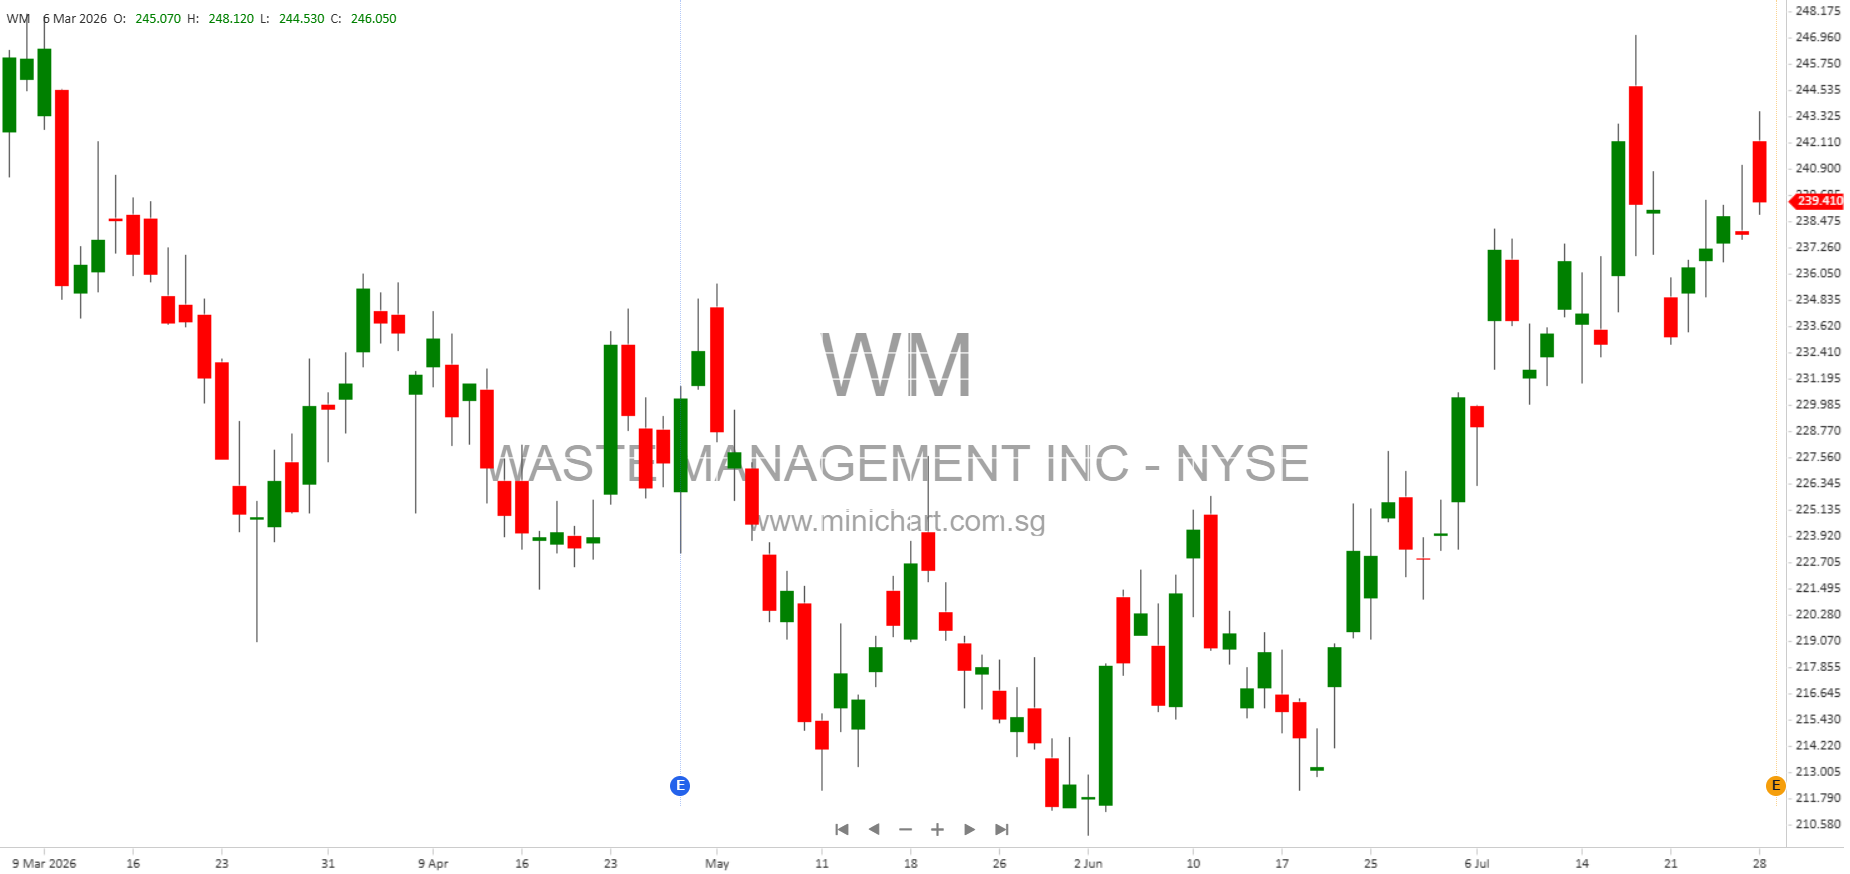
- Continued execution on price discipline, efficiency, and sustainability projects is supporting robust cash flow and margin expansion, which could be price-supportive for shares.
- Guidance for free cash flow and EBITDA remains on track, despite a modestly lower revenue outlook, reflecting management confidence and operational flexibility.
- Strategic investments in RNG, recycling, and healthcare integration are contributing to diversified, higher-margin growth.
- Risks include integration of the Stericycle acquisition (now Healthcare Solutions segment), regulatory and environmental challenges, macroeconomic uncertainty, commodity price volatility, and execution risks on sustainability projects. These could affect future performance and are important for shareholders to monitor.
Other Notable Financial and Operating Metrics
- Balance Sheet: As of June 30, 2026, WM’s assets totaled \$46.4 billion with total liabilities of \$36.5 billion and equity of \$9.93 billion.
-
Operating Segment Revenues (Q2 2026):
- Collection and Disposal: \$5.479 billion
- Recycling Processing and Sales: \$403 million
- Renewable Energy: \$157 million
- Healthcare Solutions: \$638 million
-
Commodity Pricing:
- Blended average price for recycled commodities: \$75/ton (down from \$84/ton last year)
- Average RNG price: \$2.23/MMBtu (down from \$2.81/MMBtu)
- Average Renewable Fuel Standard credit price: \$2.33 (down from \$2.53)
- Average electricity price: \$69/MWh (up from \$67/MWh)
- Capital Allocation: Q2 2026 capital expenditures for sustainability growth investments were \$75 million (\$136 million YTD).
- Acquisition Activity: \$123 million in gross annualized revenue acquired in H1 2026 (\$235 million total consideration, \$85 million cash paid in Q2).
Conference Call Details
WM will hold a conference call on July 29, 2026, at 10 a.m. ET to discuss these results. Interested parties can listen via webcast at investors.wm.com.
Conclusion: Why This Matters for Investors
WM continues to deliver on its commitment to operational excellence, cash flow generation, and shareholder returns. The company’s increased focus on sustainability, automation, and healthcare integration is driving margin expansion and long-term value creation. While the revenue outlook has been trimmed slightly due to volume trends, the reaffirmation of profitability and free cash flow targets, along with strong execution and capital returns, are likely to be viewed positively by investors.
Important risks remain, including acquisition integration, regulatory and market uncertainties, commodity price fluctuations, and execution on sustainability projects. Shareholders should continue to monitor management’s ability to deliver on its strategic goals and respond to evolving industry dynamics.
Disclaimer
This article is for informational purposes only and does not constitute investment advice. Investors should conduct their own due diligence and consult with their financial advisor before making any investment decisions. Forward-looking statements, as discussed in the company’s filings, are subject to risks and uncertainties that may cause actual results to differ materially from those projected.