Stanley Black & Decker Reports Strong 2Q 2026 Results: Raises Guidance, Cuts Debt, and Repurchases Shares
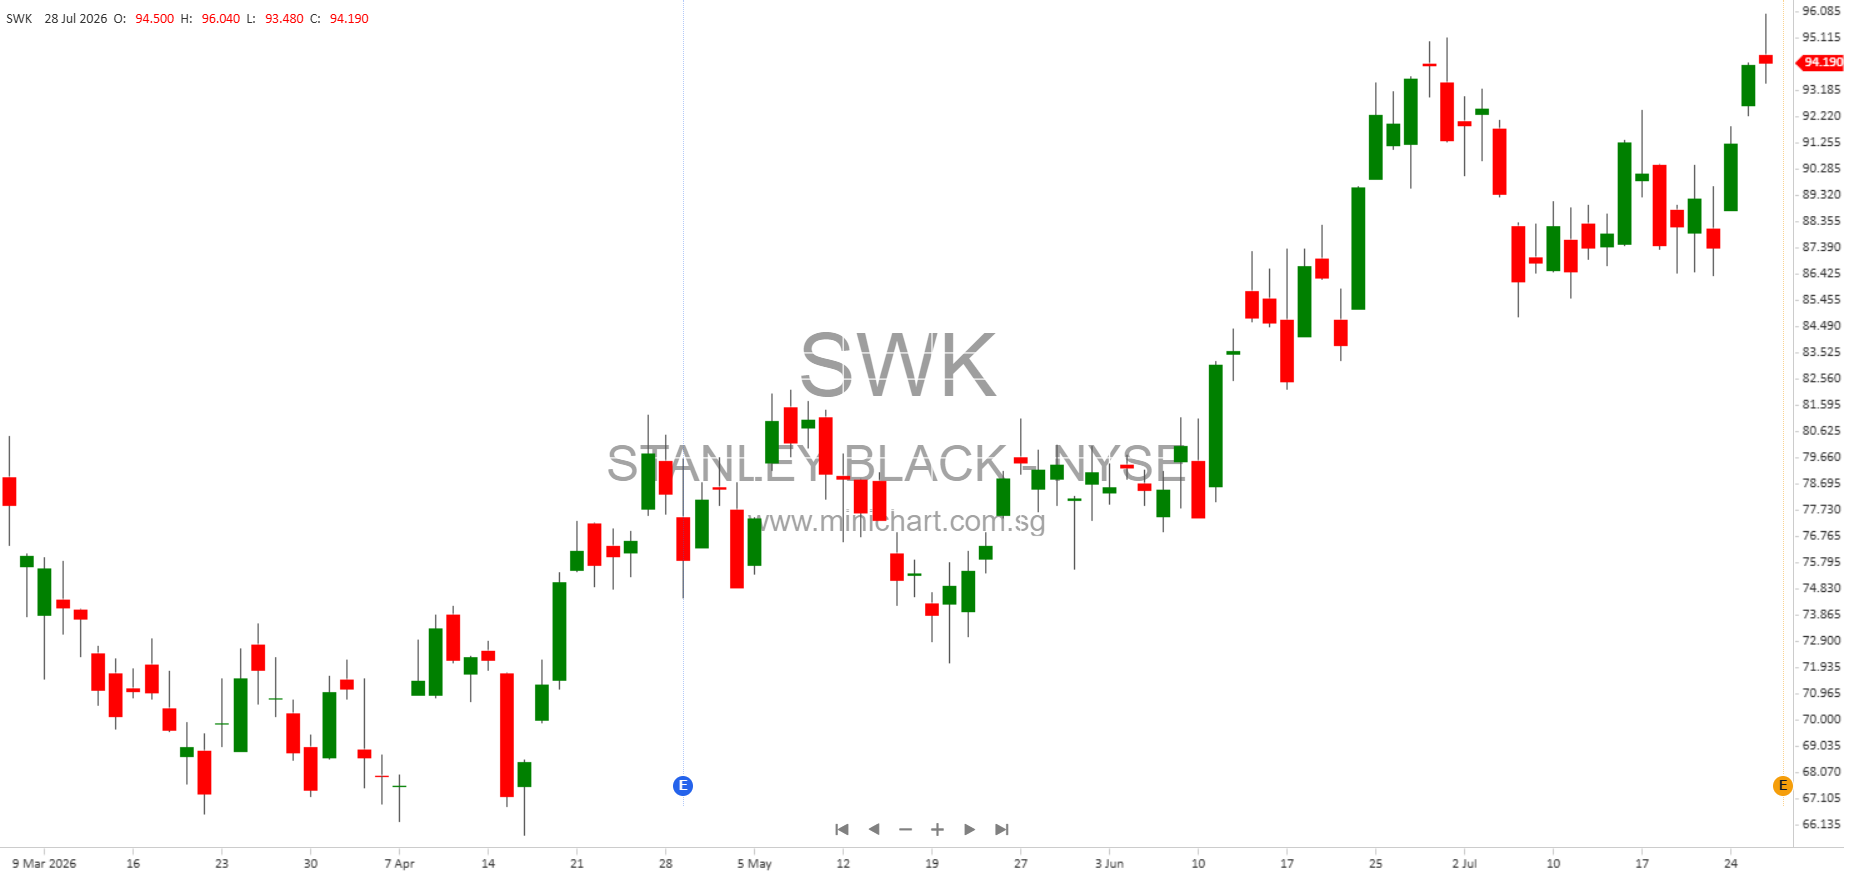
July 29, 2026 – New Britain, Connecticut: Stanley Black & Decker (NYSE: SWK), a global leader in tools and outdoor solutions, has announced robust financial results for the second quarter of 2026. The company delivered improved margins, higher earnings, and strong cash flow, driven in part by significant tariff refunds and successful execution of its strategic initiatives. The company also raised its full-year earnings and free cash flow guidance, repurchased shares, and made substantial progress in reducing debt.
Key Financial Highlights for Q2 2026
- Net Sales: \$4.0 billion, flat year-over-year, but up 3% on an organic basis.
- Gross Margin: 33.0%, up 600 basis points (bps) from the prior year; Adjusted gross margin at 33.7%, up 620 bps. Both measures included a 250 bps benefit from net tariff refunds.
- Earnings Per Share (EPS): \$2.33 GAAP; Adjusted EPS at \$1.57. Both included an approximately \$0.17 per share benefit from net tariff refunds.
- Operating Cash Flow: \$763 million; Free Cash Flow: \$698 million.
- Debt Reduction: Decreased debt by \$1.7 billion in the quarter.
- Share Repurchases: Repurchased approximately 3.2 million shares for \$250 million, under the Board-approved authorization from April 2026.
- Divestiture: Completed sale of Consolidated Aerospace Manufacturing (CAM) in April, supporting capital allocation and debt reduction.
Operational and Segment Performance
Tools & Outdoor Segment
- Sales: \$3.56 billion, up 3% year-over-year.
- Organic Growth: 3%, primarily from strong U.S. retail and commercial/industrial channels, particularly in power tools.
- Segment Margin: 10.9% (up 400 bps); Adjusted segment margin at 11.8% (up 380 bps). Margin expansion was driven by productivity gains, favorable product mix, and a 150 bps benefit from tariff refunds.
- Regional Performance:
- North America: +3% total, +4% organic
- Europe: flat total, -2% organic
- Rest of World: +8% total, +3% organic
Engineered Fastening Segment
- Sales: \$396.6 million, down 18% due to CAM divestiture (-21%), but partially offset by +2% volume and +1% pricing.
- Organic Revenues: Up 3%, driven by industrial and automotive fasteners strength.
- Segment Margin: 13.0% (up 580 bps); Adjusted segment margin at 13.0% (up 220 bps). Margin expansion was led by productivity improvements, favorable automotive volumes, and a 50 bps benefit from tariff refunds.
Guidance Update for 2026
- GAAP EPS raised to \$4.60–\$5.45 (prior: \$4.15–\$5.35).
- Adjusted EPS raised and tightened to \$5.20–\$5.80 (prior: \$4.90–\$5.70). This reflects year-over-year growth of 18% at the midpoint.
- Free Cash Flow guidance increased to \$600–\$800 million (prior: \$500–\$700 million), reflecting tariff refunds and CAM divestiture proceeds net of taxes/fees.
- The difference between GAAP and Adjusted EPS relates primarily to restructuring and footprint charges, largely offset by the CAM sale gain.
Capital Allocation and Balance Sheet Strength
- Debt reduction and share repurchases further strengthen the balance sheet and demonstrate a commitment to returning value to shareholders.
- Proceeds from the CAM sale enabled additional capital deployment in growth investments, debt paydown, dividend support, and share buybacks.
Strategic and Management Commentary
Chris Nelson, President & CEO, emphasized commitment to executing strategy for profitable, organic growth, highlighting gross margin and cash performance. The company is investing incremental funds from tariff refunds into growth, while maintaining focus on long-term financial goals and shareholder value creation.
Patrick Hallinan, CFO & CAO, reiterated the focus on delivering full-year sales and margin targets, executing the capital allocation strategy, and navigating a dynamic operating environment. Management remains committed to near- and long-term growth, margin, and cash flow objectives, supporting share value and investor returns.
Non-GAAP Measures and Adjustments
- Adjusted results exclude non-recurring items including restructuring, footprint actions, and the CAM divestiture gain. Total pre-tax non-GAAP adjustments in Q2 were a \$221.3 million net gain, primarily from the CAM sale offset by restructuring and impairment charges.
- Tariff refunds (IEEPA) were a significant driver of margin and EPS improvement, though partially offset by associated variable compensation, growth investments, and taxes.
Risks and Forward-Looking Statements
- The company cautions that its outlook is subject to risks including macroeconomic conditions, commodity prices, global trade policy, regulatory changes, supply chain disruptions, and geopolitical risks (including current conflicts in Ukraine, Israel, and tensions in Asia and the Middle East).
- Future results could differ materially from current projections due to these and other factors.
Shareholder Considerations & Potential Price-Sensitive Information
- Guidance raise for both EPS and free cash flow for 2026 is a clear positive and may be viewed as price-supportive or price-moving.
- Large-scale debt reduction and share repurchases demonstrate strong capital discipline and a focus on enhancing shareholder returns.
- Tariff refunds had a substantial, direct boost to margins and EPS, but also fueled further investment in growth, which could improve the company’s competitive positioning.
- Successful completion of the CAM divestiture not only improved the balance sheet but also provided liquidity for shareholder value-creating activities.
Disclaimer: This article is for informational purposes only and does not constitute investment advice or a recommendation to buy or sell any securities. Investors should review official filings and consult with their own advisors before making investment decisions. All forward-looking statements are subject to risks and uncertainties that could cause actual results to differ materially from projections.