Reynolds Consumer Products Inc. Announces Robust Q2 2026 Results and Upgrades Full-Year Outlook
Key Highlights from Q2 2026 Financials
- Net Revenues: \$944 million, up from \$938 million in Q2 2025.
- Retail Net Revenues: \$888 million (flat vs. Q2 2025).
- Non-Retail Net Revenues: \$56 million, up from \$51 million in Q2 2025.
- Net Income: \$89 million, up 22% from \$73 million in Q2 2025.
- Adjusted Net Income: \$89 million, up from \$83 million in Q2 2025.
- Adjusted EBITDA: \$171 million, up from \$163 million in Q2 2025.
- Earnings Per Share (EPS): \$0.42, up 20% from \$0.35 in Q2 2025.
- Adjusted EPS: \$0.42, up 8% from \$0.39 in Q2 2025.
Segment Performance and Strategic Realignment
Effective January 1, 2026, Reynolds realigned its Hefty Waste & Storage and Presto Products segments to enhance efficiency and sharpen innovation focus. All prior periods have been recast to reflect this change. Notably:
- Reynolds Cooking & Kitchen Essentials:
- Net Revenues up \$19 million to \$314 million, driven by both retail and non-retail sales.
- Retail volumes decreased 8% due to promotional timing differences, but share gains in parchment, oven bags, and slow cooker liners.
- Adjusted EBITDA rose \$4 million to \$53 million, primarily due to manufacturing efficiency gains.
- Hefty Waste & Clean-Up:
- Net Revenues decreased \$3 million to \$233 million.
- Retail volumes were flat, branded volume gains offset private label losses.
- Hefty Ultra Strong trash bags featured as a top 5 Amazon Prime Day item.
- Adjusted EBITDA dropped \$3 million to \$69 million.
- Hefty Home & Tableware:
- Net Revenues down \$25 million to \$217 million, primarily due to foam declines.
- Retail volumes fell 14%; excluding foam, retail volumes decreased 8%.
- Adjusted EBITDA up \$8 million to \$43 million, offsetting lower volumes with decreased promotional activity.
- Hefty Storage & Organization:
- Net Revenues up \$9 million to \$176 million, a record for Q2.
- Retail volumes increased 8%, led by strong performance of Hefty and store brand food bags.
- Adjusted EBITDA decreased \$3 million to \$27 million due to costs from new business ramp-up and promotional support for new distribution.
Year-to-Date Performance (First Half 2026)
- Net Revenues: \$1,821 million, up from \$1,756 million in the prior year.
- Retail Net Revenues: \$1,692 million, up from \$1,652 million.
- Non-Retail Net Revenues: \$129 million, up from \$104 million.
- Net Income: \$148 million, up from \$105 million (2025 included \$27 million of after-tax costs that did not repeat).
- Adjusted Net Income: \$148 million, up from \$132 million.
- Adjusted EBITDA: \$302 million, up from \$279 million.
- EPS: \$0.70, up from \$0.50; Adjusted EPS \$0.70 vs. \$0.63.
Balance Sheet & Cash Flow
- Cash & Equivalents: \$66 million at June 30, 2026 (down from \$147 million at year-end 2025).
- Debt: \$1,530 million.
- Net Debt: \$1,464 million.
- Net Debt to Trailing Twelve Months Adjusted EBITDA: 2.1x, at the lower end of company’s target range.
- Voluntary Principal Repayment: \$50 million during first half 2026.
- Operating Cash Flow: \$173 million for the first six months (up from \$147 million in 2025).
- Investing Cash Flow: (\$101) million used for property, plant, and equipment acquisitions.
- Dividends: \$96 million paid in first half.
2026 Guidance: Upgraded Outlook and Q3 Preview
- Full-Year 2026 Net Revenues: Revised upward to +1% to +3% growth vs. 2025 (\$3,721 million), reflecting increased pricing net of elasticity.
- Full-Year Net Income & Adjusted Net Income: Expected range \$331 million to \$343 million.
- Full-Year EPS & Adjusted EPS: Expected range \$1.57 to \$1.63.
- Full-Year Adjusted EBITDA: Expected range \$660 million to \$675 million.
- Q3 2026 Net Revenues: Expected to be flat vs. Q3 2025 (\$931 million).
- Q3 Net Income & Adjusted Net Income: Expected range \$79 million to \$83 million.
- Q3 EPS & Adjusted EPS: Expected range \$0.37 to \$0.39.
- Q3 Adjusted EBITDA: Expected range \$160 million to \$165 million.
Dividend Announcement
The Board of Directors has approved a quarterly dividend of \$0.23 per common share, payable August 31, 2026, to shareholders of record as of August 17, 2026.
Strategic Initiatives & Productivity
Management emphasized operational efficiency, productivity initiatives, and targeted capital deployment as key drivers of earnings growth in a challenging consumer and cost environment. Manufacturing efficiency gains offset lower volumes and higher SG&A costs. The company continues to invest in brands, innovation, and strategic growth initiatives.
Market Share & Brand Strength
Reynolds maintained or gained share in most categories, with strong retail partnerships and brand value. The company holds #1 or #2 market share in most served categories. Hefty Ultra Strong trash bags were a top seller on Amazon Prime Day 2026, bolstering brand visibility.
Price Sensitivity & Potential Share Price Impact
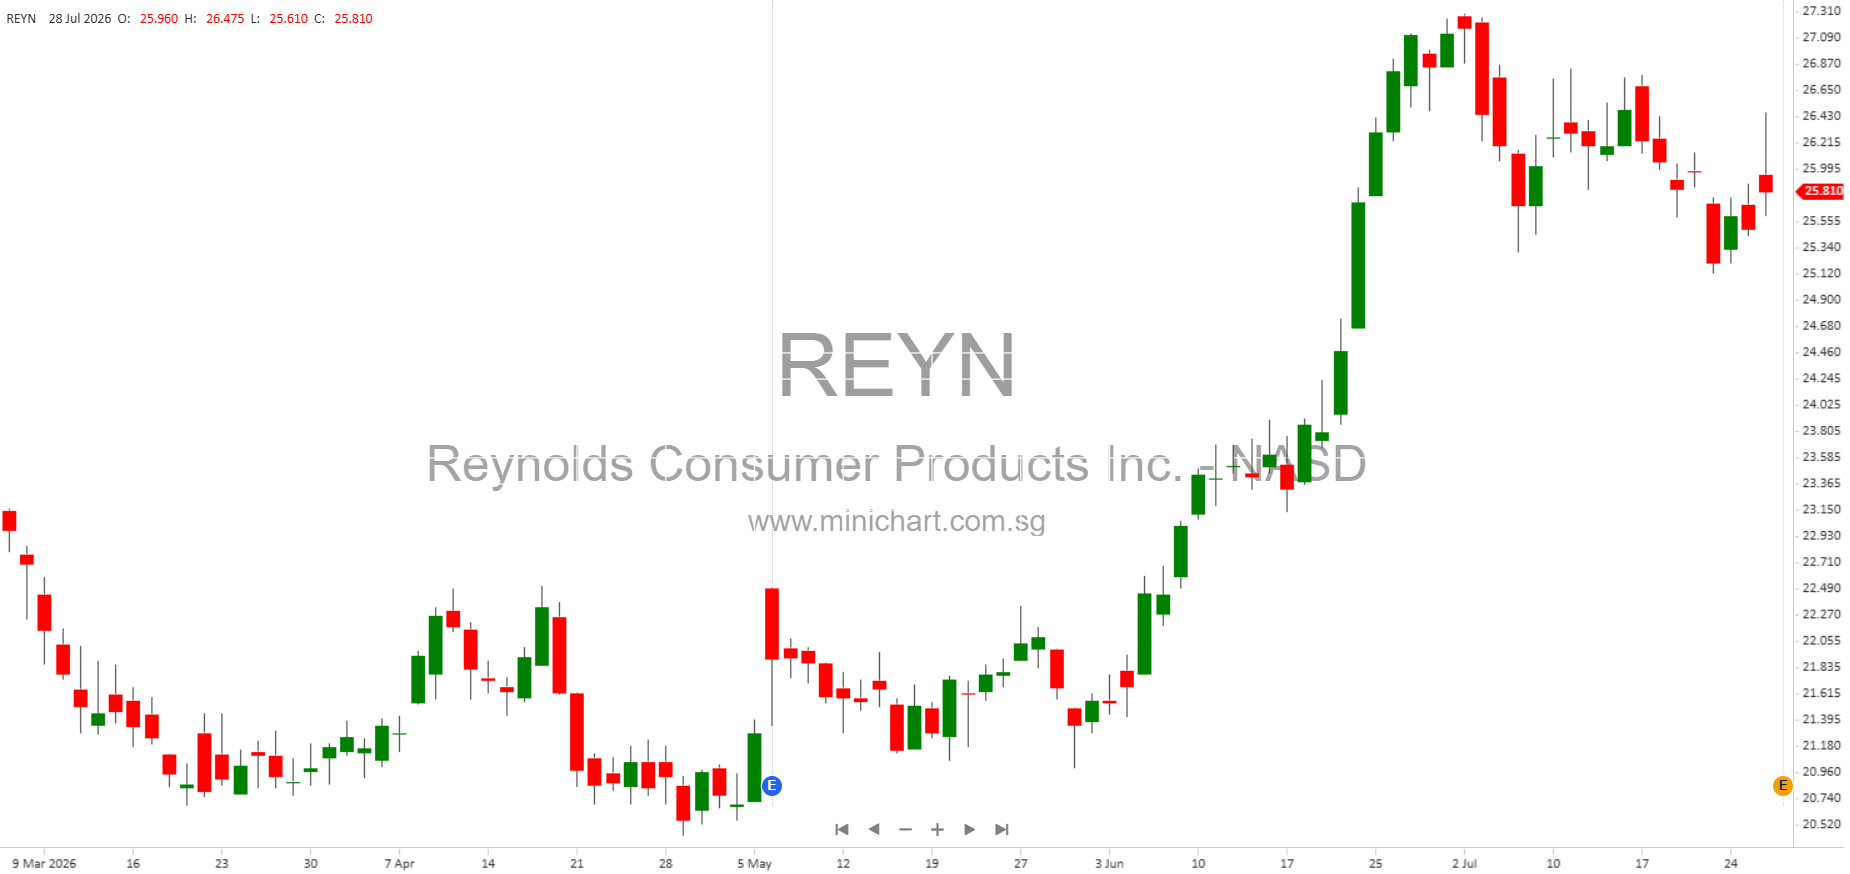
- Upgraded full-year revenue and earnings guidance is likely to be price-sensitive for investors.
- Strong operational execution and disciplined capital deployment may underpin share price support.
- Dividend continuity demonstrates confidence in cash flow and shareholder return.
- Low leverage (Net Debt/EBITDA 2.1x) signals financial stability amid ongoing investment in growth.
- Efficiency gains in manufacturing and segment realignment support margin expansion, which could drive positive investor sentiment.
- Risks: The company notes ongoing inflationary pressures, volume declines in certain segments, and higher SG&A expenses as potential headwinds.
Forward-Looking Statements & Risks
Reynolds Consumer Products reminds investors that forward-looking statements are subject to risks and uncertainties, including inflation, commodity costs, retailer decisions, and consumer demand trends. Investors should review SEC filings for detailed risk disclosures.
Conclusion
This Q2 2026 report contains several price-sensitive developments: upgraded full-year guidance, dividend continuity, segment realignment, and operational efficiency gains. Investors should consider these factors in light of market conditions and company-specific risks.
Disclaimer: This article is provided for informational purposes only and does not constitute investment advice. Investors should review official filings and consult their financial advisor before making investment decisions. All forward-looking statements are subject to risks and uncertainties as disclosed by Reynolds Consumer Products Inc. in its SEC filings.