Parsons Corporation Reports Q2 2026 Earnings: Key Developments, Strategic Actions, and Updated Guidance
Summary of Key Results
- Book-to-bill ratio: 1.2x for Q2, exceeding 1.0x in both segments. Parsons has maintained a trailing twelve-month (TTM) book-to-bill ratio of 1.0x or greater in every quarter since its 2019 IPO.
- Contract Awards: 24% year-over-year increase, underlining robust demand and Parsons’ strategic positioning.
- Backlog: Total backlog increased to \$9.3 billion, with funded backlog at \$6.6 billion.
- Revenue: Q2 revenue was \$1.6 billion, down 1% year-over-year and 5% on an organic basis. If excluding confidential contract and portfolio-shaping actions, revenue grew 8% (3% organically).
- Net Income: Net loss of \$15 million for the quarter, down \$70 million year-over-year, largely due to an \$85 million net loss from portfolio-shaping actions and charges on a joint venture program.
- Adjusted EBITDA: Decreased 72% to \$42 million. Excluding \$118 million of charges, adjusted EBITDA stood at \$161 million, up 8% year-over-year.
- Adjusted EBITDA Margin: Contracted 670 basis points to 2.7%. Excluding charges, adjusted EBITDA margin improved 70 basis points to 10.1%.
- EPS: Adjusted diluted EPS was \$(0.06), compared to \$0.78 in Q2 2025.
- Portfolio-shaping initiatives: Implemented to drive profitable, sustainable growth and enhance long-term shareholder value. Actions included divestitures and a significant joint venture charge.
- Middle East: 10% organic revenue growth, with a 1.1x book-to-bill ratio, indicating continued regional resiliency.
Segment Performance
Critical Infrastructure
- Revenue: \$815 million for the quarter, up 5% year-over-year.
- Adjusted EBITDA: \$56 million, down 32% year-over-year. Margin contracted from 10.5% to 6.9%, due to portfolio actions.
- Six-Month Performance: Revenue of \$1,548 million (+4% YoY); Adjusted EBITDA \$135 million (-13% YoY).
Federal Solutions
- Adjusted EBITDA: Q2 loss of \$14 million (down from \$67 million profit in Q2 2025), reflecting the impact of charges and divestitures.
- Six-Month Performance: Adjusted EBITDA \$58 million (-59% YoY).
Major Charges and Portfolio-Shaping Actions
- A pre-tax gain of \$19.3 million from the divestiture of two SETA contracts.
- A pre-tax loss of \$77.5 million on two contracts held for sale.
- A \$40.9 million pre-tax charge related to a joint venture project affected by adverse weather and program delays.
These one-time events had a significant negative impact on GAAP earnings, but management emphasizes they are not reflective of ongoing operations.
Updated Fiscal Year 2026 Guidance
| Current Guidance | Prior Guidance | |
|---|---|---|
| Revenue | \$6.2B – \$6.5B | \$6.5B – \$6.8B |
| Adjusted EBITDA | \$500M – \$560M | \$615M – \$675M |
| Operating Cash Flow | \$430M – \$490M | \$470M – \$530M |
Note: The company has not provided a GAAP to Adjusted EBITDA reconciliation for guidance due to the inherent difficulty of forecasting certain items.
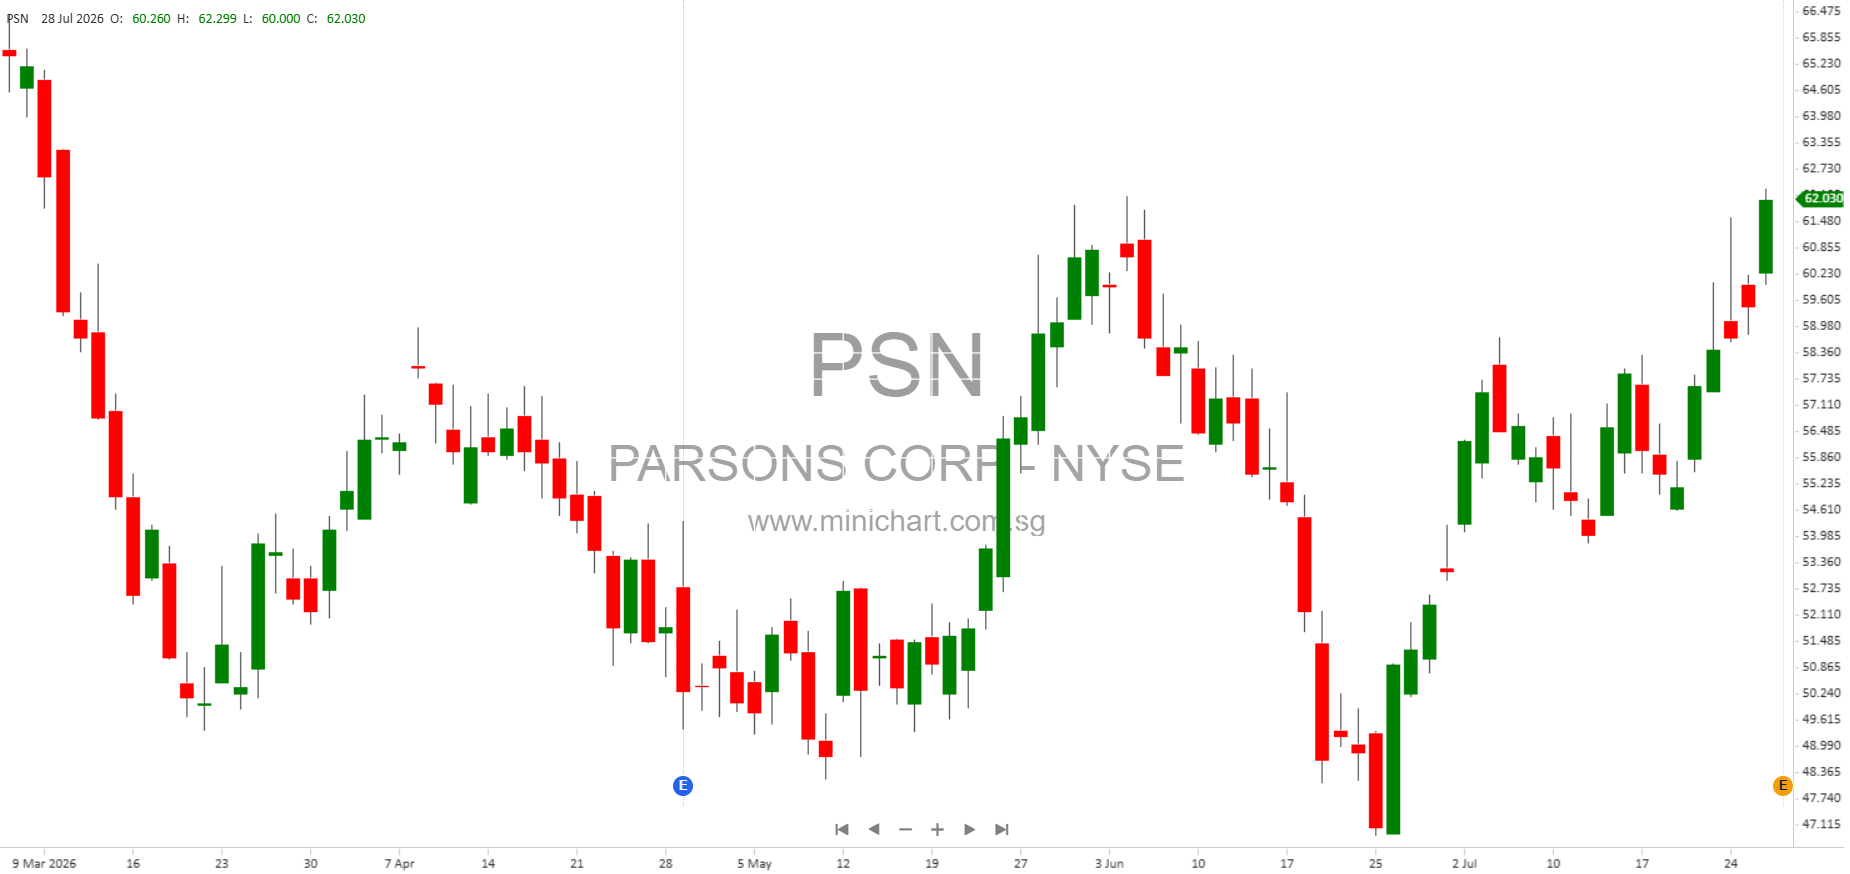
This downward revision to guidance is likely to be price sensitive and could negatively affect share price in the near term.
Balance Sheet and Cash Flow Highlights
- Total Assets: \$6.1 billion as of June 30, 2026.
- Cash and Equivalents: \$266 million, down from \$466 million at year-end 2025, reflecting acquisition activity and portfolio actions.
- Total Debt: \$1.47 billion, up from \$1.09 billion at year-end 2025.
- Net Cash from Operating Activities (YTD): \$53.9 million, down from \$148 million for the same period in 2025.
- Net Cash Used in Investing Activities: \$(386.5) million, driven by acquisitions and investments in joint ventures.
- Net Cash Provided by Financing Activities: \$133.4 million, largely from increased borrowings.
Backlog and Book-to-Bill Ratios
- Total Backlog: \$9.26 billion (vs. \$8.94 billion in Q2 2025).
- Federal Solutions: 1.3x book-to-bill for Q2 (vs. 0.8x in prior year).
- Critical Infrastructure: 1.1x book-to-bill for Q2 (flat year-over-year).
- Overall Company Book-to-Bill: 1.2x for Q2, 1.3x for six months YTD.
Strong contract wins and pipeline support visibility into future growth despite near-term profitability challenges.
Strategic and Operational Highlights
- Parsons recognized as a 2026 VETS Indexes 5 Star Employer (fourth consecutive year), highlighting veteran hiring and retention efforts.
- Portfolio-shaping actions are intended to drive a focus on profitable and sustainable growth, with legacy or underperforming programs divested or exited.
- Notable project: Horse Canyon Phase 4 in British Columbia.
Risks and Forward-Looking Considerations
- Results were heavily impacted by one-off charges related to portfolio rationalization and an adverse joint venture, which management stresses are not expected to recur.
- Revised guidance signals lower expected revenue, EBITDA, and cash flow for the full year, which may weigh on investor sentiment and share valuation.
- Continued strength in bookings and backlog provides some offsetting confidence in the company’s medium- and long-term outlook.
- Investors should be aware of risks detailed in the company’s SEC filings, including dependence on U.S. government contracts, competitive pressures, and execution risk on large, long-term projects.
Conference Call Information
Parsons will host a conference call on July 29, 2026, at 8:00 a.m. ET to discuss these results. The call can be accessed via the investor relations section of the company’s website.
Conclusion and Shareholder Takeaways
- The Q2 2026 results were mixed: robust demand and bookings, but significant one-off charges and portfolio actions led to a headline loss and sharply lower adjusted profits.
- Shareholders should note the downward revision to full-year guidance, which is material and likely to move the share price.
- Strong backlog and continued contract momentum are positives, but the near-term earnings and cash flow outlook is more challenging due to the strategic portfolio repositioning.
- Execution on portfolio-shaping actions and realization of cost savings or improved margins will be key to restoring profitability and supporting the share price.
Disclaimer: The information presented above is a summary of Parsons Corporation’s Q2 2026 earnings report and related disclosures. This article is for informational purposes only and does not constitute investment advice. Investors are encouraged to review the full SEC filings and consult their financial advisors before making investment decisions. The author and publisher accept no liability for actions taken in reliance on the information contained herein.