Orange County Bancorp, Inc. Reports Record Second Quarter 2026 Earnings
Middletown, N.Y., July 28, 2026 – Orange County Bancorp, Inc. (NASDAQ: OBT), parent company of Orange Bank & Trust Co. and Orange Investment Advisors, Inc., has announced its financial results for the second quarter ended June 30, 2026. The company posted record earnings for the period, highlighting robust growth in net income, improved net interest margins, and continued expansion of its low-cost deposit base.
Key Financial Highlights
- Net Income: Increased by \$3.2 million, or 30.6%, reaching \$13.7 million for Q2 2026, compared to \$10.5 million in Q2 2025. Year-to-date net income for the first half of 2026 was \$24.9 million, up 30.1% from \$19.2 million in the prior year period.
- Earnings Per Share (EPS): Rose by \$0.15, or 17.2%, to \$1.02 per share for Q2 2026, compared to \$0.87 per share in Q2 2025. For the first half of 2026, EPS was \$1.87, up from \$1.64 in 2025.
- Net Interest Margin (NIM): Expanded by 38 basis points to 4.44% in Q2 2026 from 4.06% in Q2 2025, driven by higher loan yields and lower deposit costs.
- Total Deposits: Increased by \$120.8 million, or 5.2%, to \$2.4 billion at June 30, 2026, up from \$2.3 billion at June 30, 2025. Growth was primarily in core, low-cost deposits, enabling a reduction in high-cost brokered deposits and borrowings.
- Total Loans: Approximately \$2.0 billion at June 30, 2026, stable with year-end 2025 and up from \$1.9 billion at June 30, 2025.
- Book Value per Share: Increased by \$1.60, or 7.5%, to \$22.87 at June 30, 2026, from \$21.27 at December 31, 2025. Tangible book value per share rose 7.7% to \$22.44 over the same period.
- Return on Average Assets (ROA): 2.03% for Q2 2026, up from 1.62% in Q2 2025.
- Return on Average Equity (ROE): 18.36% in Q2 2026, compared to 19.41% in Q2 2025.
- Efficiency Ratio: Increased to 62.1% in Q2 2026 from 51.6% in Q2 2025, primarily due to a one-time valuation loss on loans held-for-sale. Adjusted efficiency ratio would have been 53.0% for the quarter, excluding this loss.
- Wealth Management Division: Assets under management or advisory were \$1.7 billion at June 30, 2026, down 11.4% from year-end 2025, reflecting the aftereffects of divisional restructuring. Earnings for the division were \$3.2 million, down 5.2% year-over-year but largely stable sequentially.
Key Management Commentary
President and CEO Michael Gilfeather emphasized the bank’s success in growing its low-cost deposit base and strengthening its net interest margin. Gilfeather cited the strategic plan’s resilience and the organization’s focus on navigating challenging conditions.
“Our success reflects the unrelenting focus of our organization and ability to navigate challenging financial conditions as we continue to execute our strategic plan,” said Gilfeather.
Important and Potentially Price-Sensitive Items
- Reversal of Deferred Tax Valuation Allowance: The company reversed the valuation allowance associated with its deferred tax asset, resulting in a one-time benefit of approximately \$5.3 million in earnings for the quarter. This is a significant non-recurring item that boosted net income and is a key factor for investors to consider when evaluating the sustainability of earnings.
- Valuation Loss on Loans Held-for-Sale: The company recognized a \$4.8 million valuation loss on loans held-for-sale, which negatively impacted noninterest income for the quarter. This is a notable, potentially non-recurring charge that affected reported results and the efficiency ratio.
- Deposit Costs and Funding Strategy: The average cost of deposits decreased to 0.96% in Q2 2026 from 1.31% a year ago, reflecting the bank’s ability to attract organic, low-cost funding—a key competitive advantage in a rising rate environment.
- Asset Quality and Credit Loss Provisions: The provision for credit losses improved due to slower loan growth, accelerated repayments, and resolution of certain nonperforming credits, further supporting earnings.
- Strong Capital Ratios: The bank’s capital ratios remain well above regulatory requirements: Tier 1 capital-to-average-assets at 13.15% and total capital-to-risk-weighted-assets at 19.20% at June 30, 2026.
- Liquidity Position: The bank reported significant unused borrowing capacity (\$597 million at FHLBNY and \$20 million with correspondent banks), and had no brokered deposits as of quarter-end.
Other Financial Details
- Non-Interest Income: For Q2 2026, noninterest income was a loss of \$0.6 million, compared to \$7.3 million in Q2 2025. The decline was due to the aforementioned valuation loss on loans held-for-sale.
- Non-Interest Expense: Increased to \$17.3 million for Q2 2026, up from \$16.8 million a year earlier, primarily due to higher compensation, benefits, and professional fees.
- Loan Portfolio Composition: Commercial real estate loans accounted for the largest share, followed by commercial and industrial loans.
- Asset Quality: Non-performing loans to total loans increased to 1.16% at June 30, 2026, from 0.61% a year earlier. Allowance for credit losses to non-performing loans decreased to 118.86% from 242.51%, reflecting improved asset performance.
Potential Impact on Shareholders and Stock Price
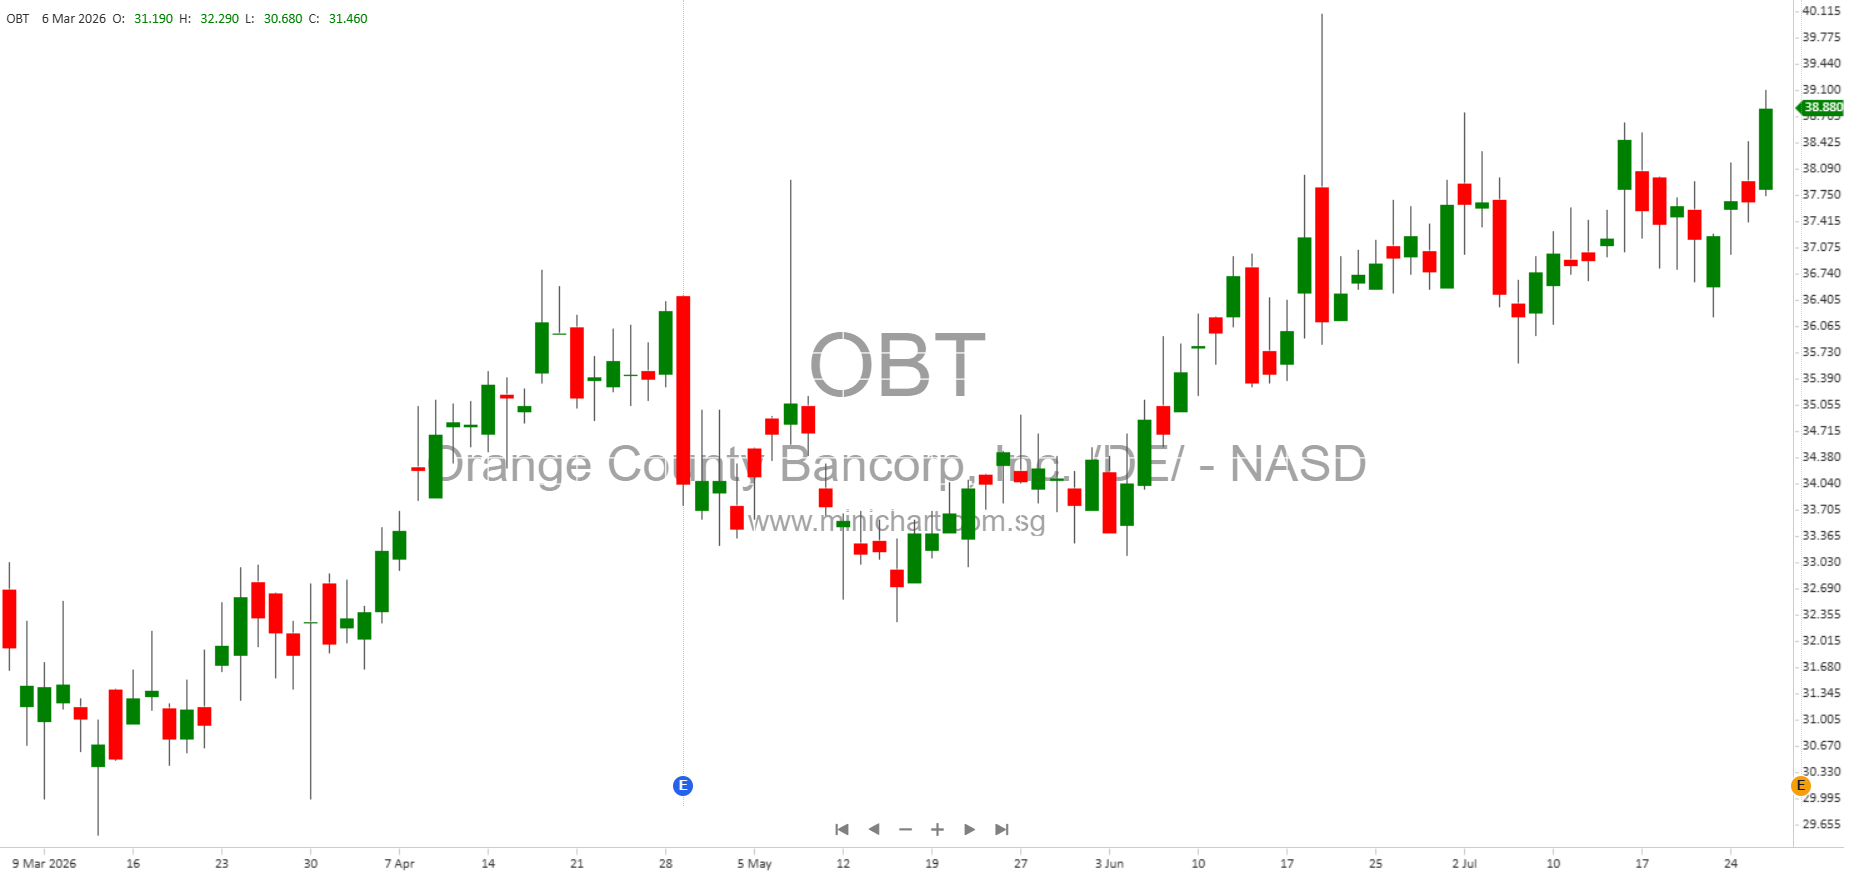
The combination of record earnings, materially improved net interest margins, and successful deposit gathering strategy are all positive, potentially share price-moving developments. However, investors should also note the one-time positive impact from the deferred tax valuation allowance reversal and the one-time negative impact from the valuation loss on loans held-for-sale. The latter could raise questions about the risk quality of the loan portfolio, while the former inflates current period earnings but may not recur. The reduction in brokered deposits and strong liquidity position are additional positives for the bank’s risk profile.
Wealth Management’s stabilization is also important, as this division remains a key part of the company’s strategy, though assets under management have declined due to prior restructuring. The company’s continued discipline in cost management and capital strength should support investor confidence.
Summary Table of Key Metrics (Q2 2026 vs. Q2 2025)
| Metric | Q2 2026 | Q2 2025 | Change |
|---|---|---|---|
| Net Income | \$13.7M | \$10.5M | +30.6% |
| EPS | \$1.02 | \$0.87 | +17.2% |
| Net Interest Margin | 4.44% | 4.06% | +38 bps |
| Total Deposits | \$2.4B | \$2.3B | +5.2% |
| Book Value / Share | \$22.87 | \$21.27 (Dec 2025) | +7.5% |
| Wealth Mgmt. AUM | \$1.7B | \$1.9B (Dec 2025) | -11.4% |
| Noninterest Income | -\$0.6M | \$7.3M | – |
| Efficiency Ratio | 62.1% | 51.6% | +10.5 pts |
Conclusion
Orange County Bancorp, Inc.’s Q2 2026 results are a net positive for investors, demonstrating the bank’s earnings power, prudent balance sheet management, and strategic execution. The impact of one-time items should be considered when projecting future results. The company’s robust liquidity, capital position, and success in core deposit gathering position it well for continued growth and resilience amid changing market conditions.
Disclaimer: This article is for informational purposes only and does not constitute investment advice. While the information is based on the company’s official financial filings, investors should conduct their own due diligence and consult with professional advisers before making investment decisions. Past performance is not indicative of future results.