Omnicom Group Inc. Q2 2026 Financial Results: Detailed Investor Breakdown
Key Points and Financial Highlights
- Quarter Ended: June 30, 2026
- Company Status: Large Accelerated Filer, fully compliant with SEC filing requirements
- Exchange Listings: Common Stock (\$0.15 par value) and several Senior Notes are actively traded on the New York Stock Exchange under symbols OMC, OMC/27, OMC/34, etc.
Consolidated Balance Sheet Highlights (in millions)
| June 30, 2026 (Unaudited) |
Dec 31, 2025 | |
|---|---|---|
| Total Assets | \$49,903.0 | \$54,415.3 |
| Total Current Assets | \$23,217.4 | \$27,000 (inferred) |
| Total Shareholders’ Equity | \$9,661.8 | \$12,045.8 |
| Total Equity (including non-controlling interests) | \$10,272.2 | \$12,693.0 |
Profitability and Earnings Overview
| Q2 2026 | Q2 2025 | Six Months 2026 | Six Months 2025 | |
|---|---|---|---|---|
| Net Income (attributable to Omnicom) | \$605.5M | \$277.8M | \$1,024.2M | \$581.2M |
| Net Income (overall, all interests) | \$605.5M | \$277.8M | \$1,024.2M | \$581.2M |
| Earnings Per Share (Basic) | \$2.09 | \$1.32 | \$3.43 | \$2.78 |
| Earnings Per Share (Diluted) | \$2.08 | \$1.31 | \$3.41 | \$2.77 |
Important Shareholder Information
- Omnicom delivered a strong increase in net income year-over-year, with net income attributable to shareholders rising from \$581.2M for the first six months of 2025 to \$1,024.2M for the same period in 2026 – an increase of over 75%.
- Earnings per share (EPS) also showed significant growth, with basic EPS for the six months climbing from \$2.78 to \$3.43, and diluted EPS from \$2.77 to \$3.41.
- However, total assets decreased from \$54.4B to \$49.9B, and shareholder equity declined from \$12.0B to \$9.7B, which may suggest significant distributions (such as dividends or share buybacks) or other capital structure changes. Investors should review the notes for further detail on these movements.
- Omnicom’s accumulated other comprehensive loss remains high at over \$1.29B, and the value of treasury stock increased to \$10.02B, which may indicate ongoing share repurchase activity.
Other Potentially Price-Sensitive Items
- Interest Expense: The company reported \$123.2M in interest expense for Q2 2026, up from \$62.6M in Q2 2025. This sharp rise may reflect increased leverage or higher-interest debt.
- Gain/Loss on Sale of Business: A notable item is a \$34.3M gain on the sale of a business unit in 2026, which contributed to the earnings jump.
- Comprehensive Income: Comprehensive income, including items outside of net income, was \$621.3M for Q2 2026, up from \$411.3M in the prior year, indicating solid overall performance despite some headwinds in other comprehensive income.
Capital Structure and Shareholder Returns
- Share Repurchases: Large increases in treasury stock suggest the company is actively buying back shares, which can be supportive for the share price but also reduces equity.
- Dividends: While exact figures for dividends are not summarized here, the substantial use of capital for shareholder returns is implied by equity movements.
- Debt Profile: Short-term borrowings remain modest at \$62M, but interest costs are rising, which investors should monitor.
Key Risks and Forward-Looking Considerations
- The company is not a shell or emerging growth company. It is classified as a large accelerated filer and continues to meet all SEC requirements.
- The significant decrease in assets and equity, despite strong earnings growth, warrants close attention. Investors should review the full Management’s Discussion and Analysis and notes to the financial statements for details on cash flows, capital deployment, and any non-recurring items impacting these balances.
- Higher interest expense and a large amount of treasury stock suggest the company may be increasing leverage to fund buybacks, which can increase financial risk if not carefully managed.
Summary for Investors
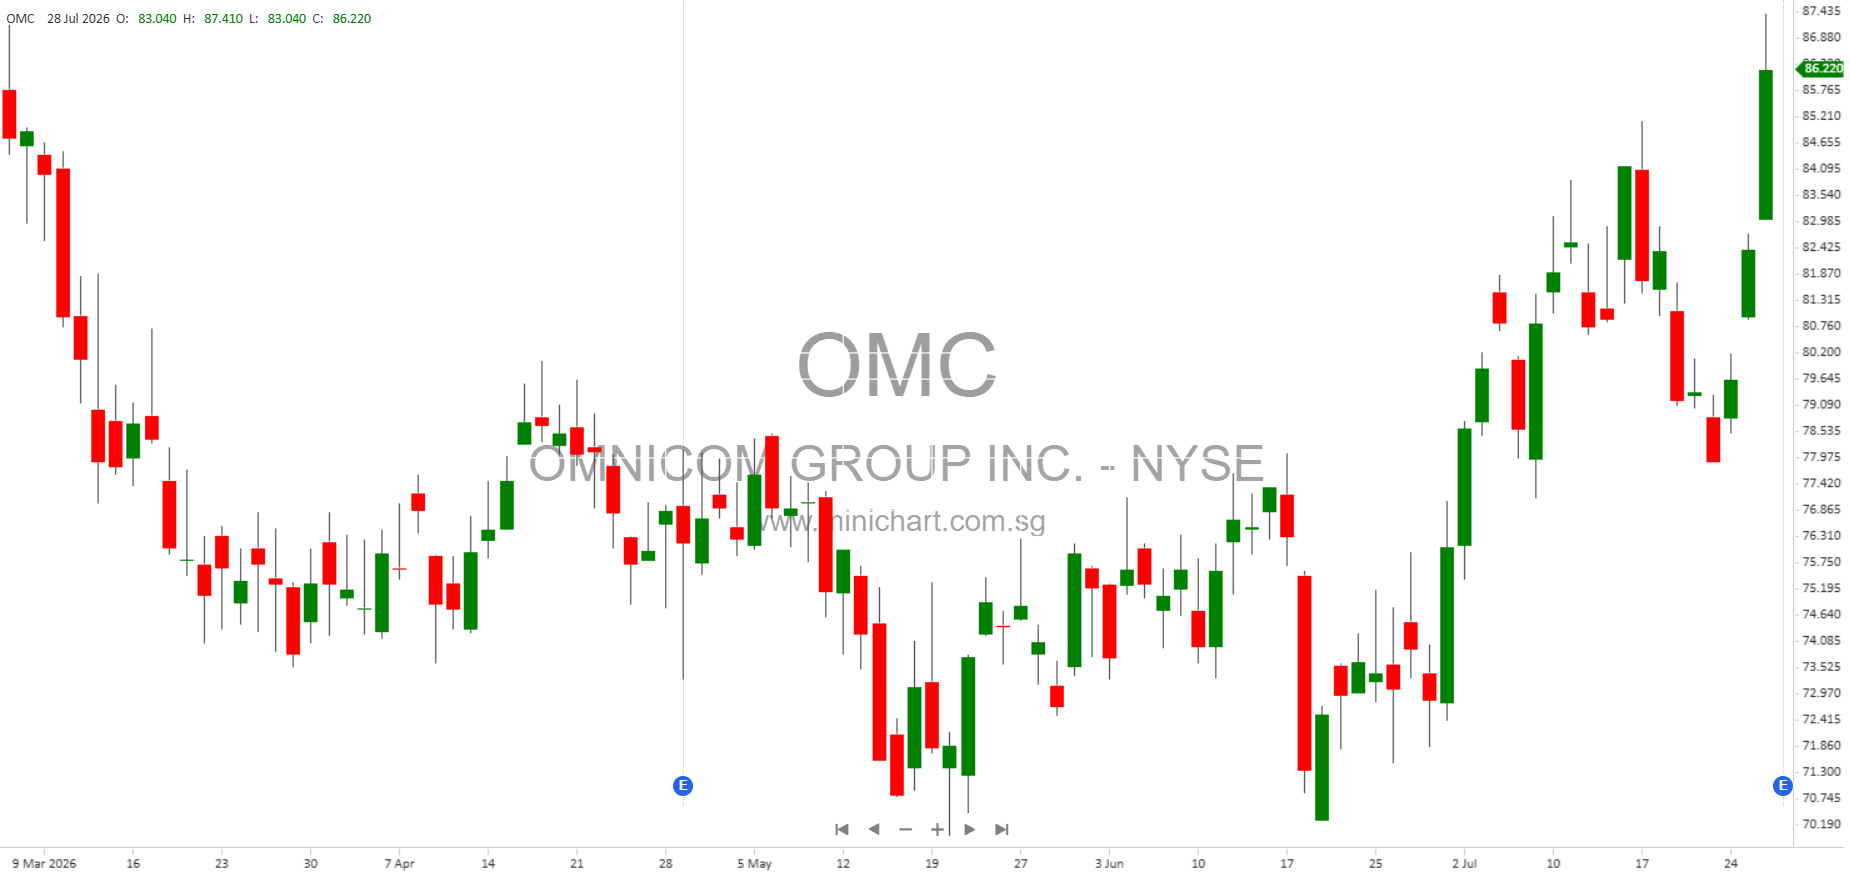
Omnicom Group Inc. reported robust earnings growth for the first half of 2026, with both net income and earnings per share up sharply from the prior year. However, total assets and shareholders’ equity declined, likely due to aggressive share buybacks and/or dividend payments. Investors should view the strong profitability as a positive, but also review the company’s capital allocation strategy as rising leverage and lower equity may signal increased financial risk. The report contains several items that could impact share price, including the large buybacks, higher interest expenses, and a significant gain from the sale of a business.
Disclaimer: This article is based on the company’s official SEC filings and public disclosures. It does not constitute investment advice. Investors should perform their own due diligence and review the full set of financial statements and notes before making any investment decisions. Past performance is not indicative of future results.