O-I Glass, Inc. (NYSE: OI) Reports Q2 2026 Results: Major Goodwill Impairment, Lowered Guidance, and Strategic Realignment
Key Financial Results for Q2 2026
- Net Sales: \$1.668 billion, down 2% year-over-year (YoY)
- Reported Net Loss Attributable to the Company: \$(972) million (Q2 2025: \$(5) million)
- Reported Loss Per Share: \$(6.33) (Q2 2025: \$(0.03))
- Earnings (Loss) Before Income Taxes: \$(827) million (Q2 2025: \$7 million)
- Adjusted (Non-GAAP) Earnings Per Share (Diluted): \$0.09 (Q2 2025: \$0.53)
- Segment Operating Profit: \$171 million (Q2 2025: \$225 million)
Price-Sensitive Highlights and Shareholder Considerations
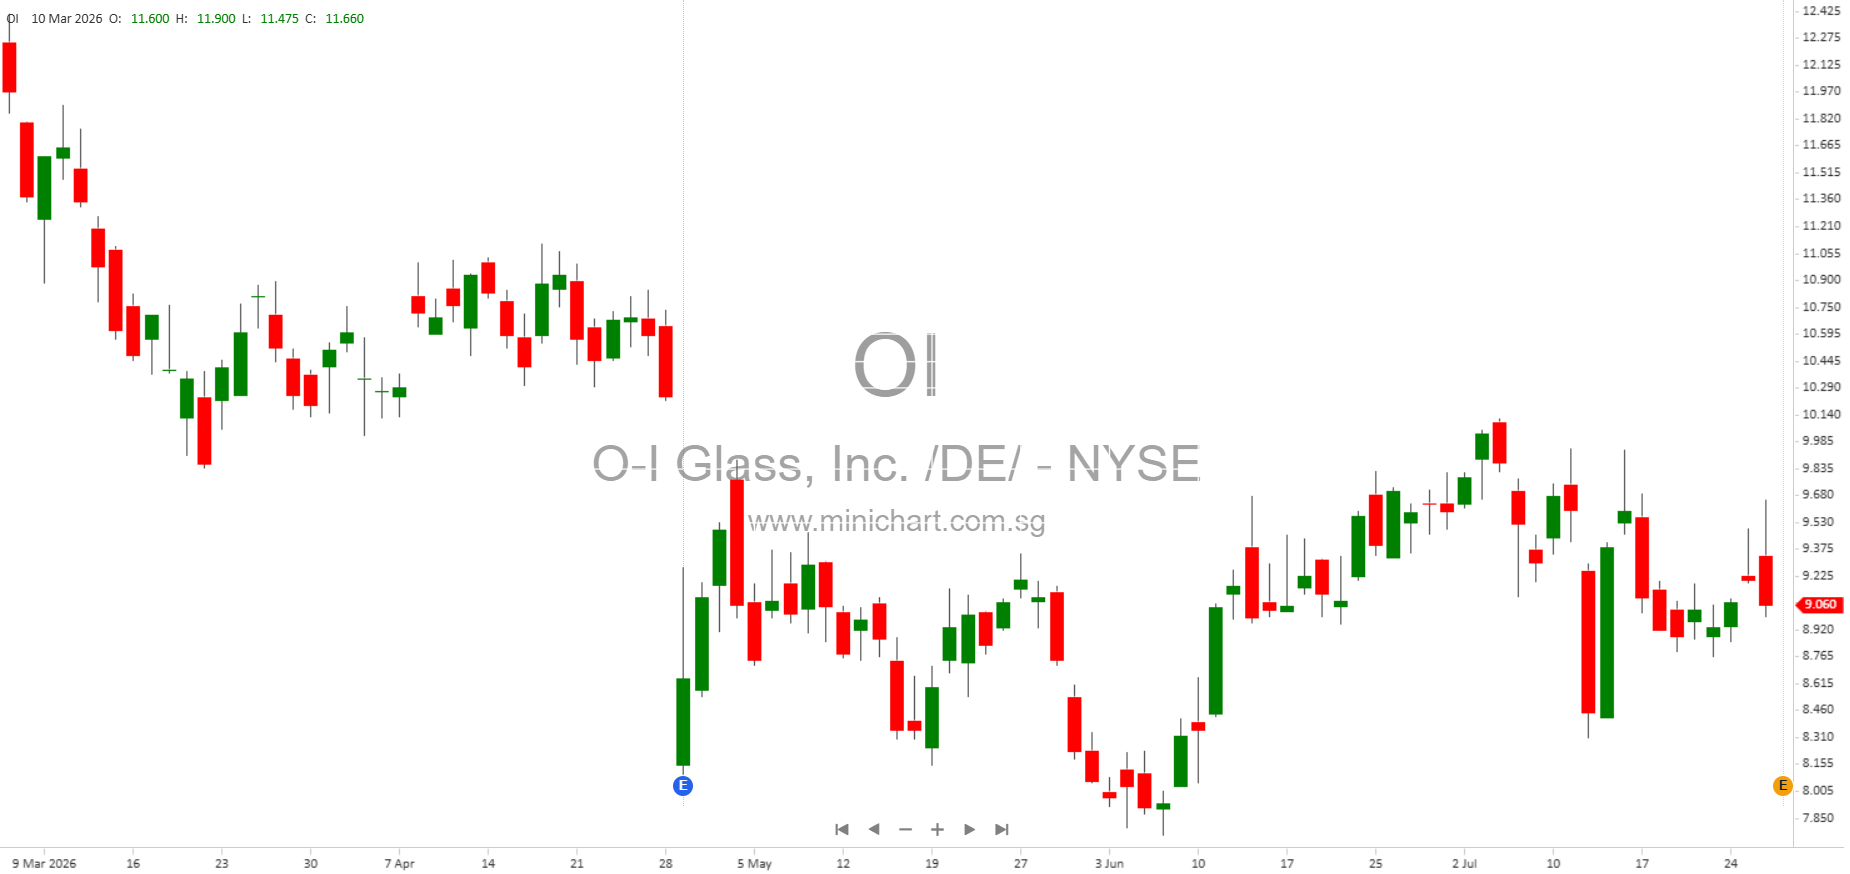
- Significant Non-Cash Goodwill Impairment: The company recorded an \$873 million non-cash goodwill impairment charge related to its European operations, driven by a decline in share price, lower current-period results, and a revised outlook for Europe.
- Increase in Deferred Tax Valuation Allowances: O-I recognized a \$96 million increase in deferred tax valuation allowances, also related to Europe, impacting the effective tax rate and future tax benefits.
- Lowered 2026 Guidance and Realigned 2027 Targets: O-I revised its 2026 adjusted EBITDA guidance down to \$1.0–\$1.1 billion (prior: \$1.125–\$1.225 billion), now expecting free cash flow to be a \$50–\$150 million use of cash (prior: \$50–\$150 million positive free cash flow) and a net debt leverage ratio at or slightly above 4x (prior: mid-3s). The 2027 adjusted EBITDA target was also reduced to \$1.2–\$1.3 billion (prior: \$1.45 billion).
- European Segment Underperformance: Operating profit in Europe collapsed to \$6 million (Q2 2025: \$90 million), with margins falling to 0.9% from 12.1%. Causes include competitive pricing pressure, elevated energy costs, and operational disruptions (notably from furnace events and plant restructuring).
- Americas Segment Outperformance: Americas operating profit rose 22% to \$165 million, with margins up to 17.4%, attributed to “Fit to Win” program benefits, favorable net price, and currency translation.
- Elevated Adjusted Tax Rate: The effective tax rate on adjusted earnings soared to 68%, mainly due to low European earnings and changes in the valuation of deferred tax assets.
- Net Cash Flow Concerns: Guidance now anticipates a use of cash for 2026, with free cash flow guidance lowered, citing ongoing operational disruptions and commercial pressures in Europe.
CEO and CFO Commentary
Gordon Hardie, CEO: “Our second quarter results fell short of expectations, driven primarily by competitive and operational challenges in Europe. We are acting decisively to address these issues… Achieving our objectives in Europe is taking longer than expected. While we believe these challenges are temporary, we have adjusted our 2026 outlook and realigned our 2027 targets to reflect a more gradual rate of improvement. We remain confident in our strategy, the actions we are taking, and our ability to create long-term value.”
John Haudrich, CFO: “We have adjusted our 2026 outlook primarily to reflect temporary elevated operating costs related to recent furnace events and major restructuring actions, as well as ongoing commercial pressure and higher energy costs in Europe. We now expect 2026 adjusted EBITDA of \$1.0–\$1.1 billion. While these headwinds are expected to gradually improve over the balance of the year, we believe the revised guidance appropriately reflects the current operating environment.”
Segment Performance Breakdown
Americas Segment
- Net Sales: \$949 million (up ~1% YoY)
- Selling Prices: Up 4%
- Sales Volumes: Down 7%, mainly due to softer demand and a furnace event (impacting ~2% of sales opportunities)
- Operating Profit: \$165 million (Q2 2025: \$135 million)
- Profit Margin: 17.4% (Q2 2025: 14.3%)
Europe Segment
- Net Sales: \$704 million (down 5% YoY)
- Selling Prices: Down 4%
- Sales Volumes: Down 2%, impacted by operational disruptions and furnace events
- Operating Profit: \$6 million (Q2 2025: \$90 million)
- Profit Margin: 0.9% (Q2 2025: 12.1%)
Strategic Initiatives and Operational Updates
- Fit to Win Program: Delivered \$65 million in gross benefits (\$50 million net of disruptions) in Q2, \$115 million gross (\$85 million net) year-to-date. The company expects \$200 million in gross benefits for 2026 and at least \$650 million over three years (revised down from \$750 million due to operational disruptions).
- Restructuring Actions: Ongoing, with significant plant restructuring and furnace events impacting European performance and guidance.
Guidance and Outlook
- 2026 Adjusted EBITDA: \$1.0–\$1.1 billion (prior: \$1.125–\$1.225 billion)
- 2026 Free Cash Flow: Use of cash of \$50–\$150 million (prior: positive \$50–\$150 million)
- 2026 Net Debt Leverage Ratio: At or slightly above 4x (prior: mid-3s)
- 2027 Adjusted EBITDA Target: \$1.2–\$1.3 billion (prior: \$1.45 billion)
- No Guidance for Adjusted EPS: Due to volatility in the effective tax rate (expected 40%–70% for 2026) stemming from low European earnings.
- Risks Cited: Macroeconomic uncertainty, geopolitical conflicts (Middle East, Russia/Ukraine), currency and energy cost volatility, supply chain disruptions, labor, and execution risk.
Balance Sheet and Cash Flow Highlights
- Cash and Equivalents: \$339 million as of June 30, 2026 (Dec 31, 2025: \$759 million)
- Total Debt: \$4.99 billion
- Net Debt: \$4.24 billion
- Shareholders’ Equity: \$539 million (Dec 31, 2025: \$1.45 billion) – significantly impacted by the goodwill writedown
- Free Cash Flow: Negative trajectory forecast for 2026
Non-GAAP Measures and Adjustments
- Significant adjustments include goodwill impairment, restructuring and asset impairment, changes in deferred tax assets, and other one-time items.
- Adjusted EPS, EBITDA, Free Cash Flow, and other non-GAAP metrics are provided; reconciliations are detailed in the report.
Forward-Looking Statements and Risks
The company highlights numerous risks that could materially affect future results, including ongoing macroeconomic challenges, competition, energy costs, supply chain disruptions, potential impairments, and geopolitical factors. Management emphasizes that forward-looking statements are not guarantees of future performance.
Investor Takeaway
The Q2 2026 report for O-I Glass, Inc. is highly material and price-sensitive. The company has warned of significant operational and commercial headwinds, especially in Europe, and took a massive \$873 million goodwill impairment charge. Revised guidance for 2026 and 2027 points to slower-than-expected recovery, ongoing cost pressures, and negative free cash flow, all of which are likely to impact investor sentiment and share valuation. Shareholders should closely monitor management’s execution of restructuring and cost-saving initiatives, as well as macro and geopolitical developments that could further affect performance.
Disclaimer: This article is for informational purposes only and does not constitute investment advice. Investors should refer to O-I Glass, Inc.’s official filings and consult with their financial advisor before making any investment decisions. The information is based on the company’s Q2 2026 earnings release and associated materials, and may be subject to change.