NeoGenomics Reports Q2 2026 Results: Profitability Returns, Share Count Update, and Key Financials
Key Highlights of the Q2 2026 Quarterly Report
- Profitability Returns: NeoGenomics, Inc. reported a net income of \$2.2 million for the quarter ended June 30, 2026, marking a significant turnaround from net losses in previous periods. This is the first quarterly profit in recent periods, compared to a net loss of \$45.1 million in the same quarter last year and a net loss of \$14.9 million for the six months ended June 30, 2026.
- Share Count and Capitalization: As of July 24, 2026, the company had 128,475,440 shares of common stock outstanding, with a par value of \$0.001 per share. The authorized share count stands at 500,000,000.
- Stockholder Equity Position: Total stockholders’ equity as of June 30, 2026, was \$836.6 million, up from \$785.7 million at the previous year-end.
- Revenue and Gross Profit: For the three months ended June 30, 2026, NeoGenomics reported gross profit of \$150.5 million, indicating strong operating leverage and possible improvements in operating efficiency.
- Operating Expenses and Income: Operating expenses remain substantial, but the company recorded a positive operating income for the quarter. Research and development costs were \$10.8 million for the quarter, and \$20.3 million for the six months ended June 30, 2026.
- Other Income: Interest income contributed positively to results, with \$2.5 million in the quarter and \$4.8 million for the first half of 2026. The company also recognized other non-operating income.
- Comprehensive Income: Total comprehensive income for the quarter was \$2.2 million, further confirming the positive financial turnaround.
Important Items and Potential Price-Sensitive Information for Shareholders
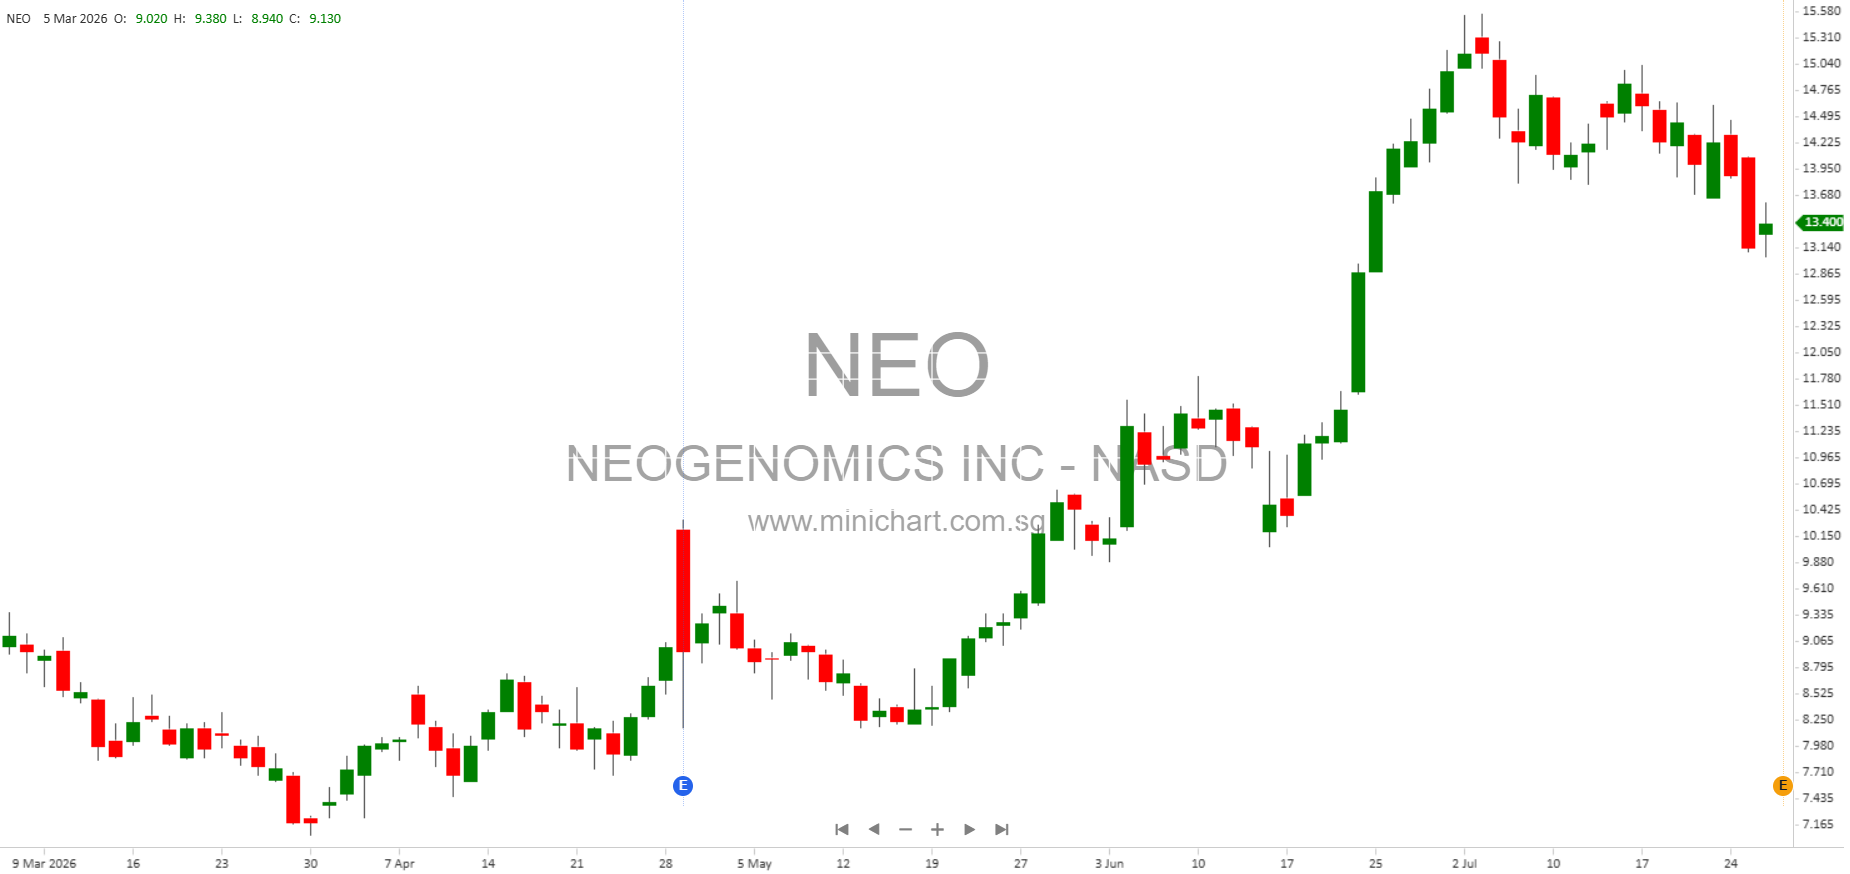
- Return to Profitability: The swing from a significant loss last year to profitability this quarter is a material event. This could be a strong driver of share price appreciation as it demonstrates turnaround progress and operational effectiveness.
- Stable and Growing Capital Base: Stockholders’ equity increased, and the company did not issue significant new equity or incur dilution, aside from routine employee stock issuances and options exercises. The share count remains stable, supporting per-share value concerns.
- Strengthened Balance Sheet: As of the quarter-end, total assets were \$1.36 billion. The company continues to show a solid financial footing, with sufficient assets to support ongoing operations and growth.
- Reduced Operating Losses/Costs: The company has managed to control operating expenses relative to revenue, which is essential for sustained profitability and long-term value creation.
- Forward-Looking Statements: The report contains forward-looking statements regarding future strategy, planned operations, growth drivers, and regulatory risks. Management highlights the potential for continued growth, but also notes regulatory and reimbursement risks, especially related to laboratory-developed tests and government payor changes.
- Stock Issuance Activity: There were routine issuances of restricted stock and options exercises, but no major equity raises or dilutive events. Employee share-based compensation was in line with expectations for a company of this size.
Other Notable Financials and Operational Details
- Weighted Average Shares: The weighted average number of shares outstanding for basic and diluted EPS calculations was approximately 129.6 million and 130.8 million, respectively, indicating very limited dilution during the period.
- Per Share Earnings: Basic and diluted earnings per share for the quarter were \$0.02, compared to a loss per share of \$(0.11) in the prior year quarter.
- Comprehensive Income Details: Other comprehensive income items, such as unrealized gains on marketable securities, were minor and did not materially affect the bottom line.
- Liquidity and Solvency: The company’s balance sheet shows strong liquidity and solvency, positioning NeoGenomics well for further growth or potential investment in business development initiatives.
- Risk Factors: The company reminds investors of ongoing risks, including regulatory changes, tariffs/trade policy impacts, and changes in reimbursement rates which could affect future results.
Conclusion
NeoGenomics, Inc.’s Q2 2026 results mark a potentially significant inflection point for the company, as it returns to profitability after a period of losses. The stabilization of the share count, growth in stockholders’ equity, and improvements in margins and cost controls are all positive developments. However, investors should also be mindful of ongoing regulatory and reimbursement risks that could impact future performance.
The return to profitability, in particular, is likely to be viewed favorably by the market and may be a catalyst for share price movement.