Overview
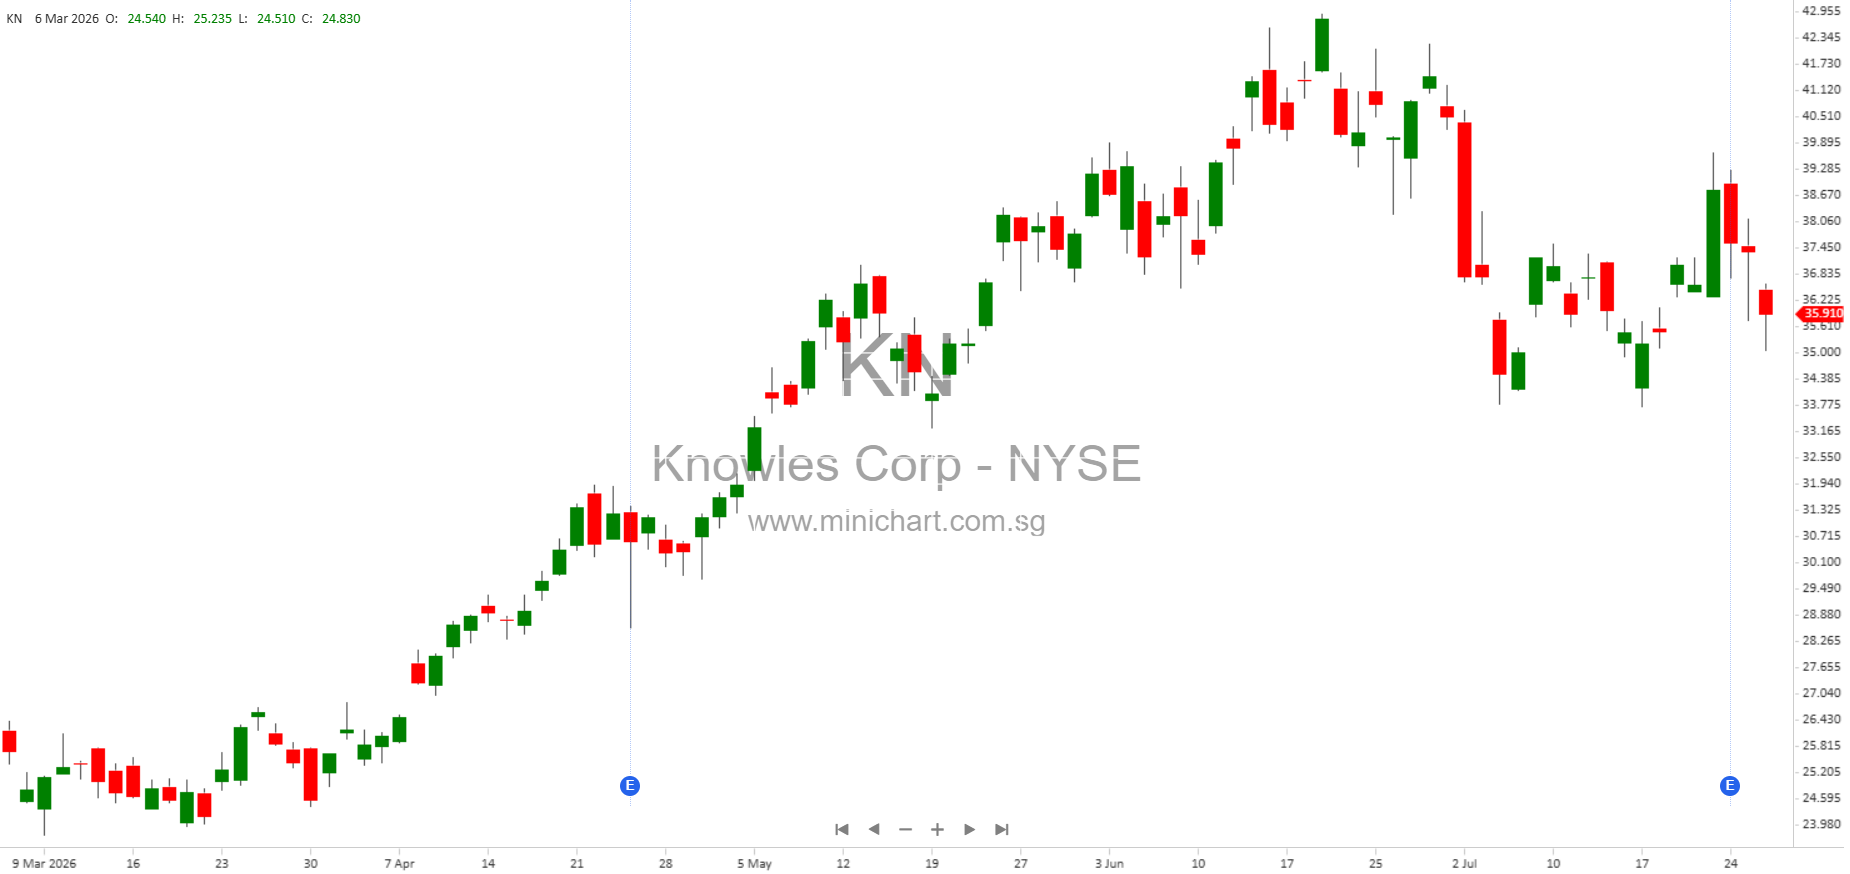
Knowles Corporation has released its unaudited financial results for the quarter ended June 30, 2026. The report presents a comprehensive view of the company’s financial performance, including revenue, net earnings, operating metrics, and other shareholder-relevant information.
Key Financial Highlights
- Revenue: Q2 2026 revenue reached \$145.9 million, up from \$141.9 million in the previous quarter.
- Net Earnings: Q2 2026 net earnings were \$19.4 million, a substantial increase compared to \$7.8 million in Q2 2025 and \$29.1 million for the six months ended June 30, 2026.
- Operating Earnings: Operating income for the quarter was \$24.7 million, up from \$14.7 million in the prior-year quarter.
- Operating Expenses: Q2 2026 operating expenses totaled \$101.1 million, compared to \$95.2 million in Q2 2025.
- Research and Development: R&D expenses for Q2 2026 were \$10.0 million, with \$22.3 million for the six months ended June 30, 2026.
- Earnings Per Share (EPS): Basic EPS from continuing operations for Q2 2026 was \$0.21, while diluted EPS was \$0.21. For the same period last year, basic EPS was \$0.09 and diluted EPS was \$0.09.
- Weighted-Average Shares Outstanding: 86.9 million basic shares and 87.6 million diluted shares were outstanding during Q2 2026.
- Comprehensive Income: Comprehensive earnings for Q2 2026 were \$21.9 million, up from \$14.4 million in Q2 2025.
Shareholder-Relevant and Potentially Price-Sensitive Information
- Strong Earnings Growth: The significant year-over-year increase in net earnings and EPS may be interpreted positively by investors and could drive the share price higher.
- Share Repurchases: Knowles repurchased 416,060 shares during the quarter at a cost of \$15.0 million. This reduction in shares outstanding can enhance future EPS and signals management’s confidence in the company’s value, which may positively affect the share price.
- Balance Sheet Strength: As of June 30, 2026, total stockholders’ equity was \$1,076.0 million, up from \$1,051.1 million at the end of the previous quarter. This increase reflects the company’s improved profitability and prudent capital management.
- R&D Investment: Continued investment in R&D indicates the company’s focus on innovation and future growth, which is important for long-term shareholders.
- Comprehensive Income Increase: The rise in comprehensive income, including gains from cash flow hedges, further strengthens the company’s financial position.
- No Indication of Shell Status or Emerging Growth Company: The company is classified as a large accelerated filer and is not an emerging growth company or a shell company, which may provide additional stability for institutional investors.
- Stock Buyback Impact: The ongoing share repurchase program reduces the number of shares in circulation and can be seen as a shareholder-friendly move, likely supporting the stock price.
Detailed Financial Tables
Three Months Ended June 30:
- 2026 Net Earnings: \$19.4 million
- 2025 Net Earnings: \$7.8 million
- 2026 Comprehensive Income: \$21.9 million
- 2025 Comprehensive Income: \$14.4 million
Six Months Ended June 30:
- 2026 Net Earnings: \$29.1 million
- 2025 Net Earnings: \$5.8 million
- 2026 Comprehensive Income: \$34.6 million
- 2025 Comprehensive Income: \$9.3 million
Other Notable Items
- Treasury Stock: The company held 15,040,703 treasury shares as of June 30, 2026. Continued buybacks may further decrease this number.
- Dividend Status: There is no indication of dividend payments in this reporting period.
- Long-Term Investments: The company’s long-term investments stood at \$83.4 million.
- Other Assets and Deferred Charges: \$101.0 million as of the end of the quarter, indicating a robust asset base.
Potential Share Price Drivers
- EPS Beat and Profit Growth: The substantial increase in earnings per share and net earnings over the prior year could attract investor interest and upward price momentum.
- Share Buybacks: The active share repurchase program not only signals management’s confidence but also directly supports the share price by reducing supply.
- Continued R&D Spending: Ongoing investment in innovation may contribute to long-term revenue and profit growth, supporting a positive outlook.
Conclusion
Knowles Corporation’s Q2 2026 report demonstrates robust financial health, profitability, and management’s commitment to shareholder value through share repurchases and sustained R&D investment. These positive financial developments are likely to be seen favorably by investors and could drive share price appreciation. Shareholders should monitor future quarters for continued earnings momentum, additional buyback activity, and further disclosures on strategic initiatives.
Disclaimer: This article is for informational purposes only and does not constitute investment advice or a recommendation to buy or sell any securities. Investors should conduct their own research or consult a financial advisor before making investment decisions. The information is based solely on the provided quarterly report and may not reflect subsequent events or market developments.