IDEX Corporation Reports Record Q2 2026 Results and Raises Full-Year Guidance
Strong Performance Driven by Healthy Demand and Operational Execution
Key Highlights:
- Record Quarterly Sales: \$921 million, up 6% reported and 5% organically.
- Record Orders: Surpassed \$1 billion, up 29% (reported) and 28% (organic).
- EPS Growth: Reported diluted EPS \$1.93 (+11% YoY); Adjusted diluted EPS \$2.32 (+12% YoY).
- Gross Margin Expansion: Gross margin rose to 46.3% (up 100 bps); Adjusted gross margin at 46.4% (+110 bps).
- Cash Flow: Operating cash flow reached \$200 million; Free cash flow \$177 million, with conversion at 103%.
- Capital Returned to Shareholders: \$77 million in share repurchases; \$54 million in dividends.
- Guidance Raised: Full-year organic growth outlook increased to 5–6% (was 3–4%), and adjusted EPS range raised to \$8.70–\$8.85 (was \$8.35–\$8.55).
- IEEPA Tariff Refunds: Net positive impact to operating results, including \$0.08 benefit to EPS and 150 bps to gross margin.
Management Commentary
Eric D. Ashleman, CEO and President, emphasized the strong sales and earnings momentum, noting that order intake hit an all-time high, driven by robust demand in targeted specialist markets. He highlighted the company’s ability to deliver earnings above expectations through volume-driven operational leverage and ongoing productivity initiatives (notably their “8020” efforts for growth and margin expansion).
Management raised full-year expectations due to strong year-to-date performance and improved visibility for the remainder of 2026.
Revised 2026 Outlook
- Organic Sales: +5% to +6% (previously +3% to +4%).
- Adjusted Diluted EPS: \$8.70 to \$8.85 (midpoint +10% YoY, previously \$8.35–\$8.55).
- Q3 2026 Organic Sales: Projected +5% to +7% YoY.
- Q3 2026 Adjusted Diluted EPS: \$2.20 to \$2.25.
Detailed Financial Results
| Metric | Q2 2026 | Q2 2025 | YoY Change |
|---|---|---|---|
| Orders | \$1,071.6M | \$829.8M | +29% |
| Net Sales | \$920.6M | \$865.4M | +6% |
| Gross Profit | \$426.8M | \$392.2M | +8.8% |
| Gross Margin | 46.3% | 45.3% | +100 bps |
| Net Income | \$143.4M | \$131.6M | +8.9% |
| Diluted EPS | \$1.93 | \$1.74 | +11% |
| Adjusted Diluted EPS | \$2.32 | \$2.07 | +12% |
| Operating Cash Flow | \$200.0M | \$161.7M | +23.7% |
| Free Cash Flow | \$177.0M | \$146.9M | +20.5% |
Segment Performance
-
Health & Science Technologies (HST):
- Net sales: \$415.0M (+14% reported, +12% organic)
- Growth driven by AI-related demand (data center power, semiconductors), space/defense, and price realization
- Adjusted EBITDA: \$119.3M (margin 28.7%, up 270 bps)
- Impact: \$9.3M sales reduction due to IEEPA tariff refunds, which reduced organic growth by 2%
-
Fluid & Metering Technologies (FMT):
- Net sales: \$317.1M (+2% reported, +1% organic)
- Strength in municipal water, semiconductors, and mining offset by declines in energy, agriculture, and chemicals
- Adjusted EBITDA: \$110.3M (margin 34.8%, down 20 bps)
- Impact: \$3.2M sales reduction from IEEPA tariff refunds, reducing growth by 2%
-
Fire & Safety/Diversified Products (FSDP):
- Net sales: \$189.9M (-1% reported/organic)
- Lower European rescue demand and dispensing businesses offset by growth in BAND-IT and price
- Adjusted EBITDA: \$54.9M (margin 28.9%, down 50 bps)
- Impact: \$2.2M sales reduction from IEEPA tariff refunds, reducing growth by 1%
IEEPA Tariff Refunds Impact
- Net Sales Impact: -\$14.7M in Q2 (consolidated; also six months YTD)
- Gross Margin: +150 bps in Q2 (consolidated)
- Adjusted EBITDA: +\$7.3M in Q2 (consolidated)
- Adjusted EPS: +\$0.08 in Q2 (consolidated)
- All segments benefited to some extent, notably via improved price/cost ratios
Balance Sheet and Cash Flow
- Strong liquidity: \$621.3M in cash and equivalents as of June 30, 2026
- Net working capital increased, largely reflecting higher sales
- Capital expenditures were higher YoY (\$23.0M in Q2), but free cash flow conversion remained robust
- Share repurchases and dividend payouts continued, signaling confidence and commitment to shareholder returns
Capital Allocation and Shareholder Returns
- \$77M in share repurchases in Q2 (total \$153.4M YTD)
- \$54M in Q2 dividends paid (\$106.7M YTD)
- Management reaffirms commitment to returning capital through both dividends and buybacks
Guidance and Forward-Looking Statements
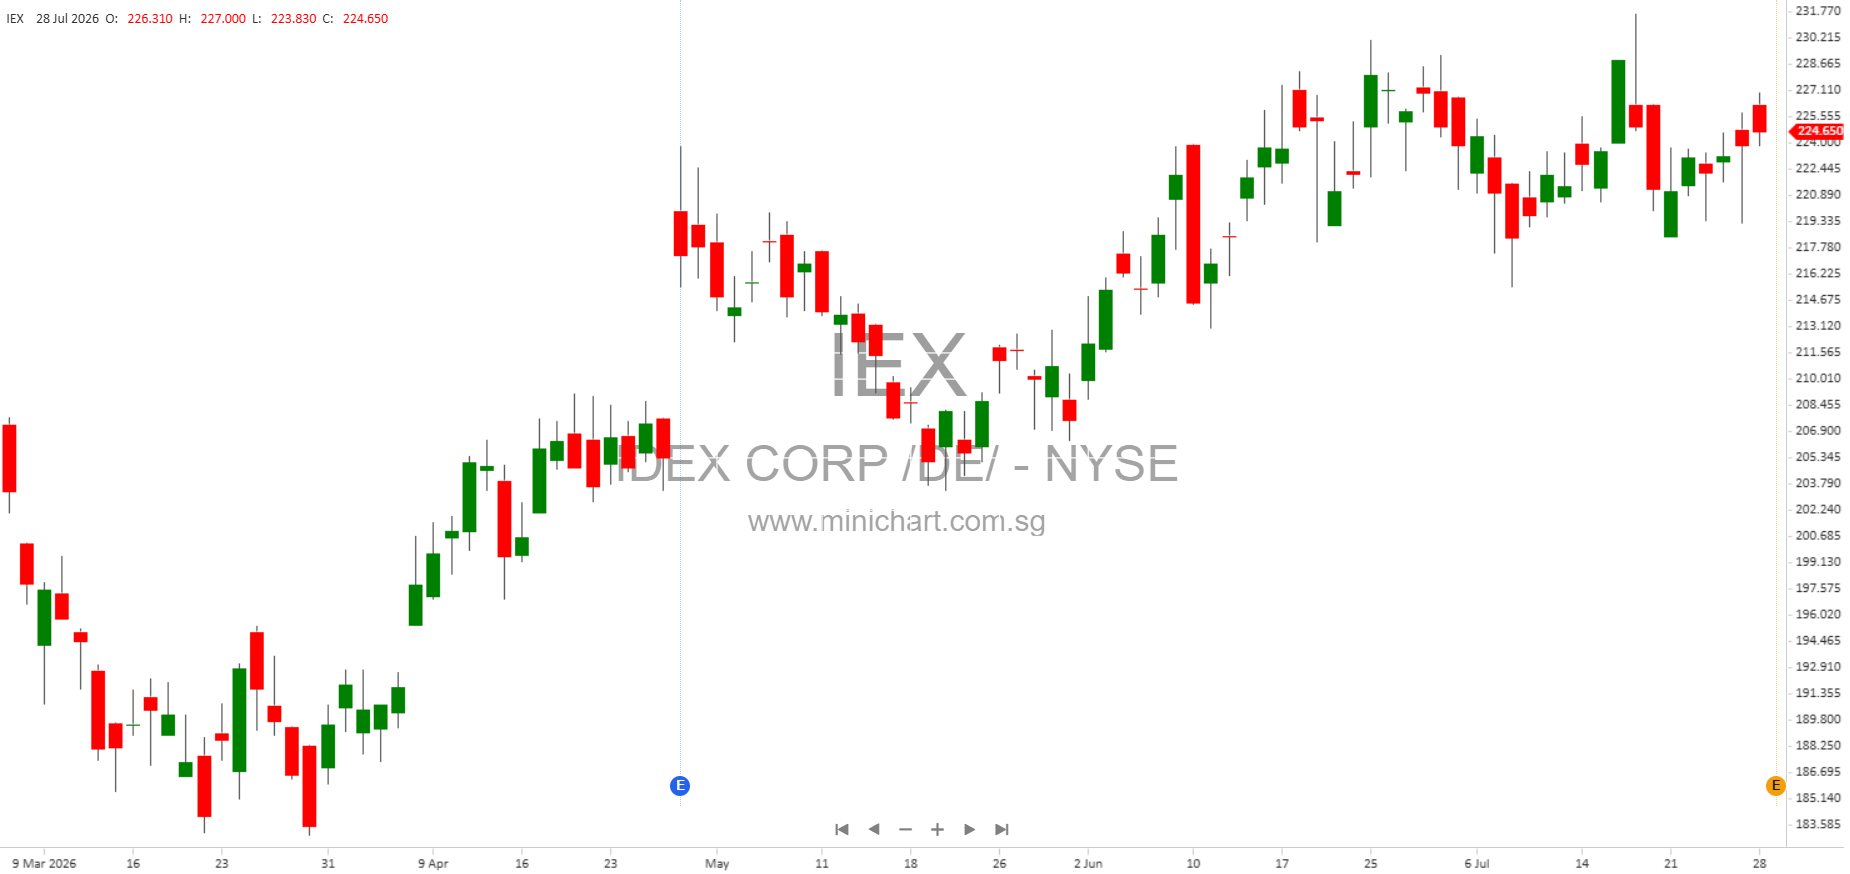
- Guidance Raised: Positive revision to both organic growth and EPS outlook for FY2026 and Q3. This is a potential share price catalyst.
- Key risks: Macroeconomic uncertainty, inflation, interest rates, global trade/tariffs, supply chain, AI demand trends, and legal/environmental matters.
- Management highlighted ongoing investments in automation, AI, and sustainability, alongside M&A activity (recent Micro-LAM acquisition).
Investors should note the explicit upward revision to full-year guidance, continued record order intake, and sustained margin expansion, all of which are likely to be positive for share price sentiment in the near term. The net positive impact of IEEPA tariff refunds is a one-off tailwind, but ongoing productivity and pricing strategies continue to support margin gains.
IDEX will hold a conference call and webcast on July 29, 2026, at 8:00 a.m. CT for further discussion.