Hayward Holdings Reports Strong Q2 2026 Results and Confirms Full-Year Guidance
Key Highlights from the Latest Earnings Report
- Q2 Financial Results Announced: Hayward Holdings, Inc. released its financial results for the three months ended June 27, 2026.
- Net Income: The company reported net income of \$45.6 million for Q2 2026, reflecting a net income margin of 14.3%.
- Adjusted Net Income: Adjusted net income was \$57.8 million, with an adjusted net income margin of 18.1%.
- Diluted EPS: Diluted earnings per share (EPS) came in at \$0.21 for the quarter, while adjusted diluted EPS was \$0.27.
- EBITDA and Adjusted EBITDA: EBITDA was \$92.2 million, and adjusted EBITDA reached \$92.7 million.
- Cash Flow: Net cash provided by operating activities was \$137.7 million for the first half of 2026.
- Cash and Investments: As of June 27, 2026, the company had \$329.6 million in cash and cash equivalents and \$179.3 million in short-term investments.
- Guidance for Full Year 2026: Management confirmed its full-year 2026 guidance, signaling confidence in continued performance.
Price-Sensitive Information and Issues for Shareholders
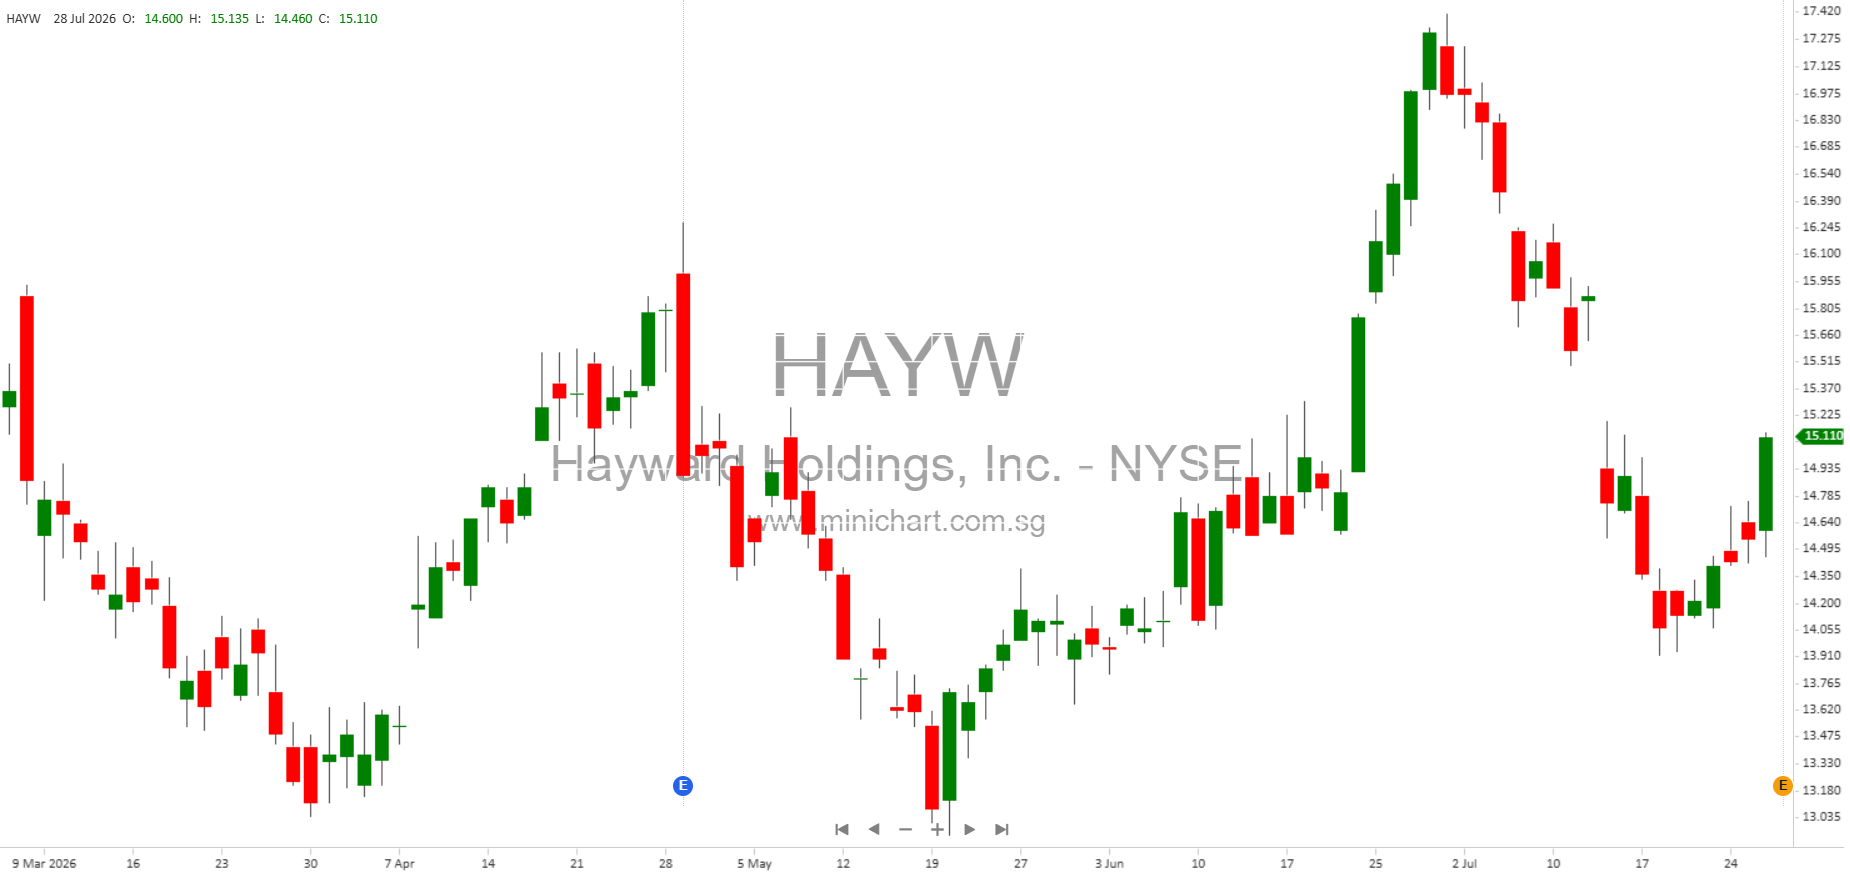
- Confirmation of 2026 Guidance: The reaffirmation of the company’s full-year financial outlook is significant. In an uncertain macroeconomic environment, confirmation of guidance may be perceived as a sign of stability and can be price-supportive.
- Strong Profitability Metrics: Both net income margin and adjusted net income margin improved, which are positive indicators of operational efficiency and profitability.
- Robust Cash Position: The company’s substantial cash and short-term investments provide financial flexibility and a buffer against market volatility.
- Share Buyback Activity: The company repurchased \$64.3 million worth of its own shares during the first half of 2026, which may be supportive of the share price.
- Debt Refinancing: Hayward refinanced \$605.4 million of long-term debt, which could improve its interest expense profile and strengthen its balance sheet.
- Competitive and Economic Risks: Management highlighted risks including market competition, dependency on distributors and builders, exposure to economic conditions, and the need to innovate in response to technological change, especially artificial intelligence.
- Non-GAAP Measures: The company continues to present and emphasize non-GAAP performance measures, which may differ from other companies and are used for internal planning and investor communication.
Detailed Financial Performance
Income Statement Metrics
- Revenue: Not explicitly listed in the summary, but net income and margin improvements suggest revenue stability or growth.
- Operating Efficiency: Improved adjusted EBITDA margin and net income margin suggest effective cost control and operational execution.
Balance Sheet Highlights
- Total Assets: \$3.12 billion as of June 27, 2026.
- Total Stockholders’ Equity: \$1.60 billion.
- Common Stock in Treasury: 33.3 million shares, reflecting ongoing buyback activity.
Cash Flow and Capital Allocation
- Operating Cash Flow: \$137.7 million in H1 2026.
- Investing Activities: \$17.4 million in capital expenditures in H1 2026; net cash used in investing activities was \$126.7 million, including \$188.8 million in purchases of short-term investments.
- Financing Activities: Net cash provided by financing was \$365.1 million, reflecting debt refinancing and share buybacks.
Strategic and Operational Risks
Hayward’s management reiterates several risk factors that could materially affect results, including:
- Reliance on distributors, builders, retailers, and servicers for product sales.
- Susceptibility to economic downturns and softer demand in the pool equipment industry.
- Competition and the need for ongoing innovation, especially as technology, including AI, evolves rapidly.
- Risks associated with international operations, credit exposure, and supply chain management.
- Potential for non-recurring or non-operational items affecting comparability of results.
The company’s ability to maintain or increase margins, execute on its buyback program, and manage debt levels are also highlighted as factors that could impact future performance and share value.
Conference Call and Additional Information
- Hayward Holdings held a conference call to discuss its Q2 results on July 29, 2026, and provided an investor presentation on its website.
- A replay of the call is available until August 12, 2026, for those interested in further details.
Conclusion
The confirmation of full-year guidance, strong profitability, robust cash flow, and active capital management (including share buybacks and debt refinancing) are notable positives for shareholders. These factors, combined with clear communication of risks and ongoing strategic initiatives, make this report highly relevant for existing and prospective investors. The company’s ability to sustain its performance in the face of industry headwinds and competitive pressures could be a key driver of share price action in the near term.
Disclaimer: This article is for informational purposes only and does not constitute investment advice. Investors should review the full company filings and consult with financial advisors before making investment decisions. The author does not guarantee the accuracy or completeness of the information and is not responsible for any losses arising from reliance on this report.