Garrett Motion Inc. Reports Strong Q2 2026 Results and Raises Full-Year Outlook
Summary
Garrett Motion Inc. (Nasdaq: GTX), a global leader in automotive and industrial technology, has released robust financial results for the second quarter of 2026. The company not only exceeded prior year performance but also increased its full-year outlook, signaling confidence in its growth trajectory. The Board of Directors declared a cash dividend, and Garrett continues to deliver on share repurchases, underscoring its commitment to shareholder returns.
Key Financial Highlights
- Net Sales: \$976 million, up 5% on a constant currency basis from Q2 2025. Including currency effects, sales rose 7%.
- Net Income: \$101 million, up from \$87 million last year; net income margin grew to 10.3% (from 9.5%).
- Adjusted EBIT: \$152 million, up from \$124 million; margin expanded to 15.6% (from 13.6%).
- Adjusted EBITDA: \$183 million, up from \$154 million; margin at 18.8% (from 16.9%).
- Net Cash Provided by Operating Activities: \$145 million (down from \$158 million in Q2 2025 due to working capital changes).
- Adjusted Free Cash Flow: \$122 million (up from \$121 million).
- Shareholder Returns: Declared a cash dividend of \$0.08 per share, payable September 15, 2026. Repurchased \$28 million in shares; \$135 million repurchase capacity remains.
Business Highlights
- Secured multiple turbocharger wins in light vehicle programs (North America) and commercial/industrial applications (China, India).
- Won major award for Garrett MEG used in data center gensets and several additional genset awards globally.
- Started pre-development of commercial vehicle e-powertrain with a Japanese truck maker.
- Received a production award for industrial air compression based on Garrett’s centrifugal compressor technology.
Detailed Performance Analysis
- Segment Growth:
- Gasoline segment up due to launches and ramp-ups in Europe, India, South America.
- Diesel segment up on strong demand for light commercial vehicles and pickups in Europe, Asia, South America, plus program ramp-ups in India.
- Commercial vehicle/industrial segment up due to strong on-highway demand in China and North America (data center gensets).
- Aftermarket volumes increased in Europe, China, Australia, favoring product mix.
- Cost Management:
- Cost of goods sold rose due to higher sales, unfavorable product mix, FX impacts, and inflation (commodity, transportation, energy).
- Productivity improvements, lower tariffs, and reduced R&D expenses partially offset cost increases.
- Profitability:
- Gross profit: \$212 million (21.7% margin), up from \$181 million (19.8%).
- SG&A: \$63 million, up from \$59 million, driven by personnel and FX, partially offset by lower bad debt expense.
- Interest expense: \$24 million (down from \$25 million) due to lower debt levels.
- Tax expense: \$25 million (up from \$15 million) due to changes in U.S. taxes, global earnings mix, and employee share-based compensation deductions.
- Cash Flow & Liquidity:
- Operating cash flow: \$145 million for Q2, \$243 million YTD.
- Adjusted free cash flow: \$122 million for Q2, \$171 million YTD.
- Liquidity: \$788 million available (including \$158 million in cash and \$630 million undrawn credit facility).
- Debt: \$1,386 million principal outstanding (down from \$1,439 million at year-end).
Full-Year 2026 Outlook (Updated)
- Net Sales: \$3.7 billion to \$3.9 billion (prior outlook: \$3.6 billion to \$3.9 billion).
- Net Sales Growth (Constant Currency): +1% to +7% (prior: -2% to +6%).
- Net Income: \$330 million to \$360 million (prior: \$300 million to \$360 million).
- Adjusted EBIT: \$560 million to \$600 million (prior: \$520 million to \$600 million).
- Operating Cash Flow: \$435 million to \$525 million (prior: \$407 million to \$522 million).
- Adjusted Free Cash Flow: \$385 million to \$475 million (prior: \$355 million to \$475 million).
Key industry assumptions:
- Light vehicle production expected to decline 2%-4% vs. 2025.
- Commercial vehicle production expected to grow 1%-2% vs. 2025.
- Average light vehicle battery electric penetration at ~19%.
- Euro/dollar exchange rate assumption: 1.16 USD (revised from 1.17).
- R&D investment at ~4.1% of sales; capital expenditures at ~2.4% of sales.
Shareholder Information & Potential Price Sensitivity
- Dividend Announcement: \$0.08 per share, payable September 15, 2026. Record date: September 1, 2026.
- Share Repurchase: \$28 million repurchased in Q2 (remaining capacity: \$135 million).
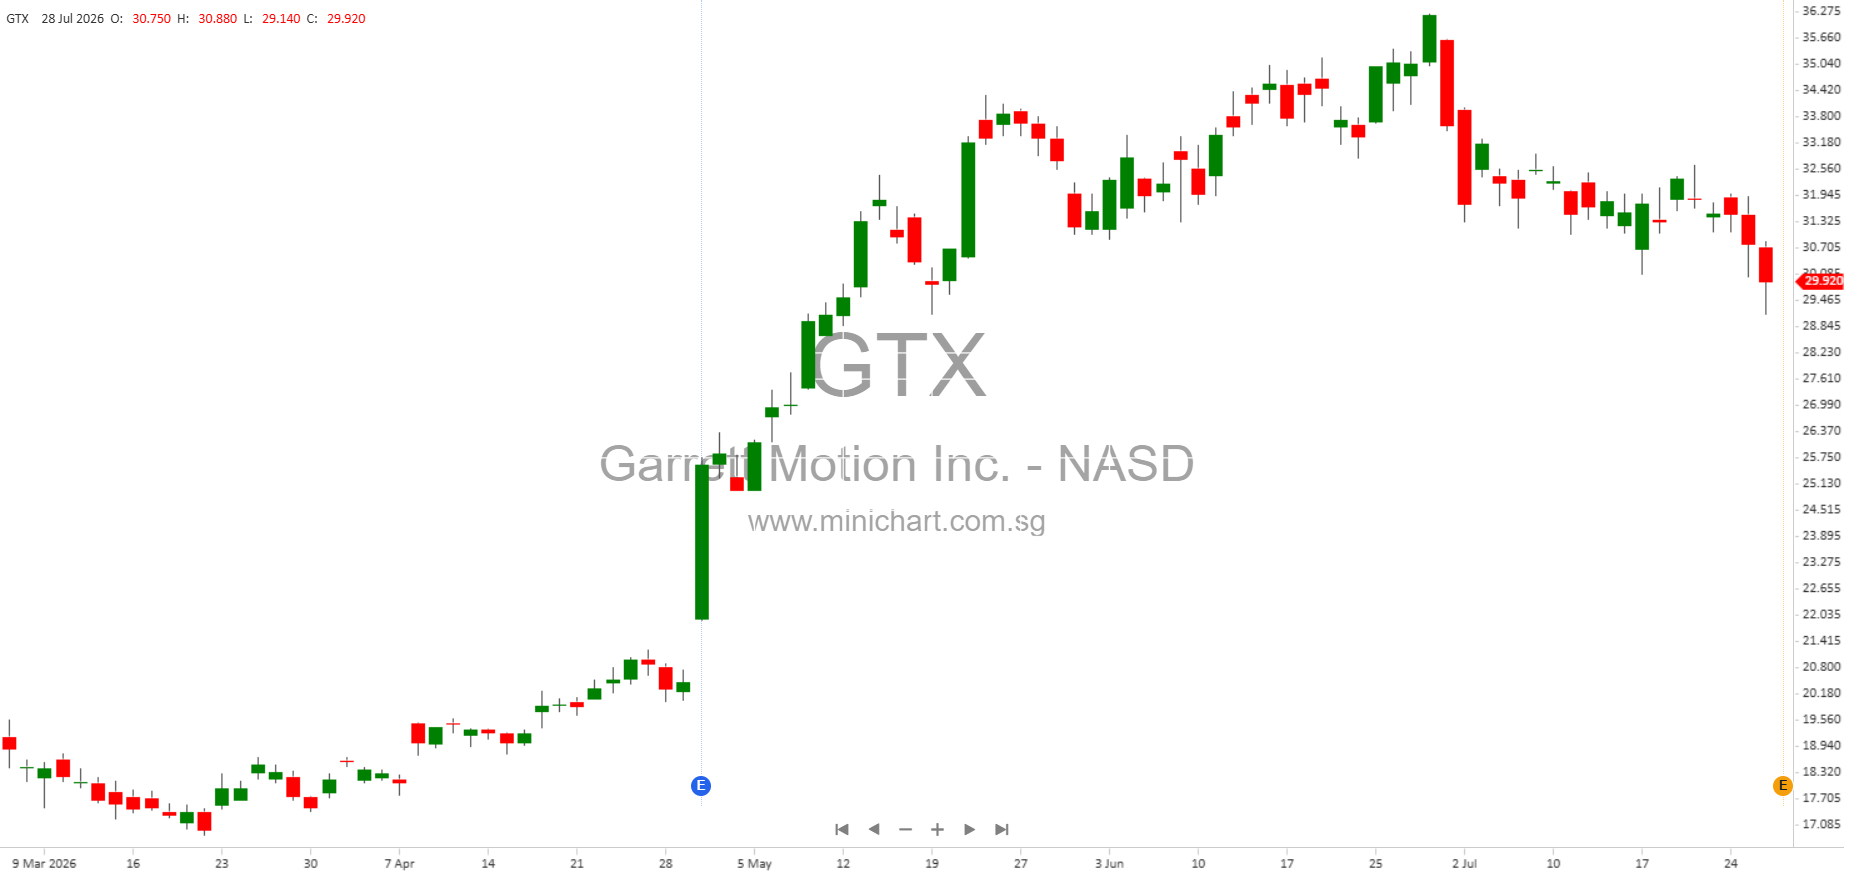
- Raised Outlook: Improved guidance across all key metrics—net sales, net income, adjusted EBIT, cash flow, which may positively affect share value.
- Strategic Wins: New contracts in turbo technology, e-powertrain, and industrial compression, indicating future revenue streams and technological leadership.
- Strong Cash Position: Robust liquidity (\$788 million), reduced debt, and continued cash generation support share buybacks and dividend payments.
- Conference Call: Scheduled for July 29, 2026, at 8:30 am EDT / 2:30 pm CET, with webcast and replay available for investors.
Company Profile
Garrett Motion is a technology leader with a 70-year legacy in automotive and industrial innovation. The company’s expertise in turbocharging, fuel cell compressors, electric propulsion, and thermal management solutions fuels its ongoing growth in both traditional and emerging sectors. Garrett operates six R&D centers, 13 manufacturing facilities, and employs over 8,700 people in more than 20 countries.
Disclaimer
This article is for informational purposes only and does not constitute investment advice. Forward-looking statements are based on current expectations and assumptions, which may change. Actual results could differ materially due to risks including industry cyclicality, competition, macroeconomic and geopolitical factors, and other risks detailed in Garrett Motion’s SEC filings. Investors should conduct their own due diligence and consult with financial advisors before making investment decisions.