Expro Group Holdings N.V. Reports Q2 2026 Results: Key Highlights for Investors
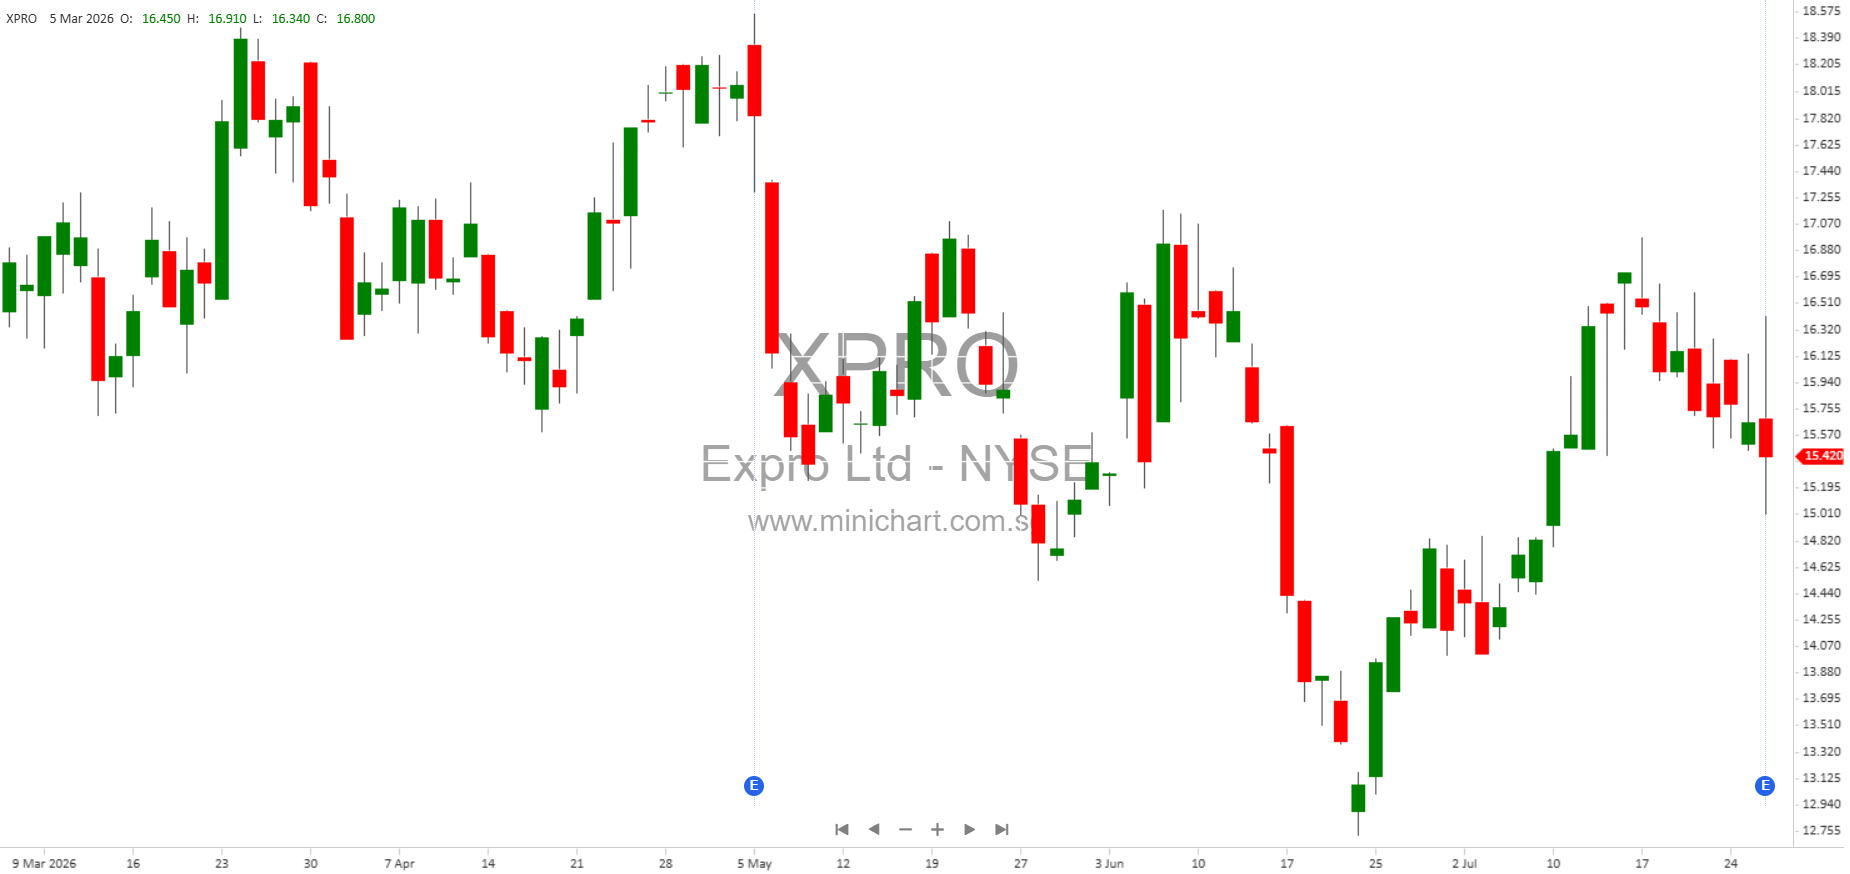
Expro Group Holdings N.V. (NYSE: XPRO) has released its unaudited financial results for the second quarter and first half ended June 30, 2026. The report provides comprehensive insights into the company’s financial health, operational performance, and other developments that shareholders should closely monitor.
Key Financial Highlights
- Net Income: For Q2 2026, Expro reported a net income of \$2.0 million, and for the six months ended June 30, 2026, net income was \$1.0 million. This is a significant decline from the same periods in 2025, when net income was \$18.0 million for Q2 and \$31.9 million for the six months.
- Earnings Per Share (EPS):
- Q2 2026 Basic EPS: \$0.01
- Q2 2025 Basic EPS: \$0.16
- H1 2026 Basic EPS: \$0.01
- H1 2025 Basic EPS: \$0.28
- Q2 2026 Diluted EPS: \$0.02
- Q2 2025 Diluted EPS: \$0.16
- H1 2026 Diluted EPS: \$0.01
- H1 2025 Diluted EPS: \$0.27
- Revenue and Operating Performance: The company’s operating performance showed a notable decline, with income before taxes dropping to \$9.4 million for H1 2026, compared to \$37.1 million in H1 2025. This is a substantial year-over-year decrease and may raise concerns for investors.
- Equity Method Investments: The company recorded \$6.0 million in income from equity method investments for H1 2026, down from \$7.1 million in H1 2025.
- Share Count: As of July 21, 2026, there were 112,349,149 ordinary shares outstanding.
- Stockholders’ Equity: At June 30, 2026, stockholders’ equity stood at \$1.51 billion, slightly down from \$1.53 billion at the end of 2025.
- Total Assets: Total assets at June 30, 2026 were \$2.26 billion, relatively stable compared to \$2.26 billion at December 31, 2025.
Balance Sheet and Liquidity
- Current Assets: \$983.8 million at June 30, 2026 (up from \$960.3 million at December 31, 2025)
- Current Liabilities: Not fully listed, but shareholders should watch for the full filing for details on short-term obligations and liquidity risks.
- Property, Plant & Equipment: Net value of \$514.6 million as of June 30, 2026
- Equity Method Investments: \$79.8 million
- Accumulated Deficit: The company’s accumulated deficit stands at \$474.5 million as of June 30, 2026, up from \$444.3 million at the end of 2025, reflecting ongoing pressure on retained earnings.
Cash Flow Highlights
- Net Cash Provided by Operating Activities: Not specifically quantified in the summary, but net income and adjustments point to reduced operational cash generation compared to the prior year.
- Stock-Based Compensation: \$15.6 million for H1 2026, up slightly from \$14.3 million in H1 2025
Other Notable Information & Potential Price-Sensitive Items
- Significant Drop in Profitability: The dramatic year-over-year drop in both net income and EPS is a key red flag and may be viewed negatively by the market. The company appears to be facing margin compression or higher costs, and this trend will be closely watched by investors.
- No New Debt, Equity, or Major Legal Developments Disclosed: As of the reporting date, there is no indication of new major litigation, unregistered equity sales, or other corporate actions that would directly move the share price, based on the provided summary table of contents and filings.
- Company Status: Expro is classified as a Large Accelerated Filer and is not a shell company. It is in compliance with all SEC reporting requirements.
- Segment Reporting: The company continues to operate four reportable segments, unchanged from prior periods.
What Should Shareholders Focus On?
- Profitability Concerns: The most significant development is the sharp fall in profit and earnings per share. This is likely to be a negative catalyst for the share price unless explained by temporary or exceptional items in the full report.
- Stable Asset Base: The company has maintained a strong balance sheet, with total assets and equity largely unchanged, which may offer some comfort to long-term investors.
- Cost Management: Investors should look for management commentary on cost controls, restructuring, or operational changes in the detailed Management Discussion & Analysis (MD&A).
- No Indication of Dividend or Buyback Changes: There is no mention of dividends or share repurchase activity, which could have been a positive or negative for the share price.
Conclusion
The Q2 2026 report from Expro Group Holdings N.V. is notable for its significant profit decline compared to the prior year. While the balance sheet remains solid, the sharp fall in earnings may prompt investor concern and could be a catalyst for share price movement. Investors are encouraged to review the full MD&A and notes for further context on the results and management’s plans to address these challenges.
Disclaimer: This article is for informational purposes only and does not constitute investment advice. Investors should review the full official filings and conduct their own due diligence before making investment decisions.