Constellium SE Reports Record Q2 2026 Results, Raises Full-Year Guidance
Date: July 29, 2026
Ticker: CSTM (NYSE)
Key Highlights
- Record financial performance in Q2 2026 across all operating segments.
- Adjusted EBITDA guidance for 2026 raised to \$980 million – \$1.02 billion (excluding non-cash metal price lag).
- Free Cash Flow (FCF) projected above \$300 million for 2026.
- Net income surged to \$148 million in Q2 2026 (from \$36 million in Q2 2025).
- Shareholder returns: \$20 million returned via share buybacks in the quarter; leverage reduced to 1.8x.
- Partial redemption of 5.625% Senior Notes due 2028: \$100 million redeemed, improving debt profile.
- Management expects to achieve 2028 strategic targets two years ahead of schedule.
Detailed Financial Performance
Quarterly and Year-to-Date Results
- Revenue: \$2.748 billion in Q2 2026 (+31% YoY); \$5.209 billion in H1 2026.
- Net Income: \$148 million in Q2 2026 (vs. \$36 million Q2 2025); \$344 million for H1 2026 (vs. \$74 million H1 2025).
- Adjusted EBITDA: \$439 million in Q2 2026 (includes positive non-cash metal price lag of \$129 million); \$798 million in H1 2026.
- Free Cash Flow: \$90 million in Q2 2026; \$95 million in H1 2026.
- Liquidity: \$1.058 billion at June 30, 2026 (comprised of \$163 million cash and \$895 million available credit facilities).
- Net Debt: \$1.76 billion at June 30, 2026 (down from \$1.824 billion at 2025 year-end).
- Leverage: 1.8x (within target range of 1.5x–2.5x; expected to trend lower).
- Share buybacks: 623,000 shares repurchased in Q2 for \$20 million; 1.8 million shares repurchased in H1 for \$48 million.
- Capital Expenditures: \$149 million in H1 2026.
Segment Performance
- Aerospace & Transportation (A&T): Segment Adjusted EBITDA of \$135 million (+61% YoY) on higher aerospace and transportation shipments and favorable price/mix.
- Packaging & Automotive Rolled Products (P&ARP): Segment Adjusted EBITDA of \$165 million (+123% YoY) driven by higher automotive shipments (benefiting from North American supply shortages), favorable price/mix, and strong recycling performance.
- Automotive Structures & Industry (AS&I): Segment Adjusted EBITDA of \$26 million (+44% YoY) despite stable shipments; lower operating costs and favorable FX helped offset unfavorable price/mix.
Strategic and Shareholder Actions
- Strong free cash flow enabled continued shareholder returns and debt reduction: \$20 million returned via share buybacks in Q2; \$100 million of 5.625% Senior Notes due 2028 redeemed in July, reducing outstanding principal to \$225 million.
- Liquidity position remains robust, ensuring flexibility to manage varying business conditions.
- Management now expects to meet 2028 targets for Adjusted EBITDA (\$900 million) and FCF (\$300 million) two years early (i.e., in 2026).
- Updated 2026 Guidance:
- Adjusted EBITDA (excl. metal price lag): \$980 million to \$1.02 billion
- Free Cash Flow: >\$300 million
- Capex: ~\$330 million
- Cash interest: ~\$125 million
- Cash taxes: ~\$105 million
- Focus remains on cost control, operational execution, capital discipline, and growing shareholder value.
Market Outlook and Risks
- Market dynamics positive: Improved aerospace, transportation, industry, defense (TID) environment; automotive rolled product shortages in North America; strong recycling in both NA and Europe.
- Geopolitical and macro risks: Management notes ongoing volatility, including conflicts (Russia/Ukraine, Middle East) and economic risks (inflation, tariffs, currency).
- Impact from Middle East conflict appears manageable at this time, but long-term effects remain uncertain.
- End market outlook: Aerospace, packaging, and automotive demand remain resilient with favorable long-term trends.
Non-GAAP Measures
- Adjusted EBITDA, Free Cash Flow, and Net Debt are regularly cited, but management warns these are not directly comparable to GAAP measures or across peers.
- Management states it is not able to provide a reconciliation of Adjusted EBITDA guidance to net income due to the unpredictability of items such as derivative gains/losses, metal price lag, restructuring, impairment, and taxes.
Management Commentary
“We delivered record financial performance across all of our operating segments again this quarter, including record quarterly Segment Adjusted EBITDA at our A&T and P&ARP segments. We benefited from strong operational focus, cost control and improved market dynamics… Based on our current outlook, we are raising our guidance for 2026 and now expect Adjusted EBITDA in the range of \$980 million to \$1.02 billion and Free Cash Flow in excess of \$300 million. With this revised guidance, we now expect to achieve our 2028 targets two years ahead of schedule… Our focus remains on executing our strategy, driving operational performance, controlling cost, maintaining commercial and capital discipline, generating Free Cash Flow and increasing shareholder value.”
– Ingrid Joerg, CEO
Important Shareholder Considerations & Price-Sensitive News
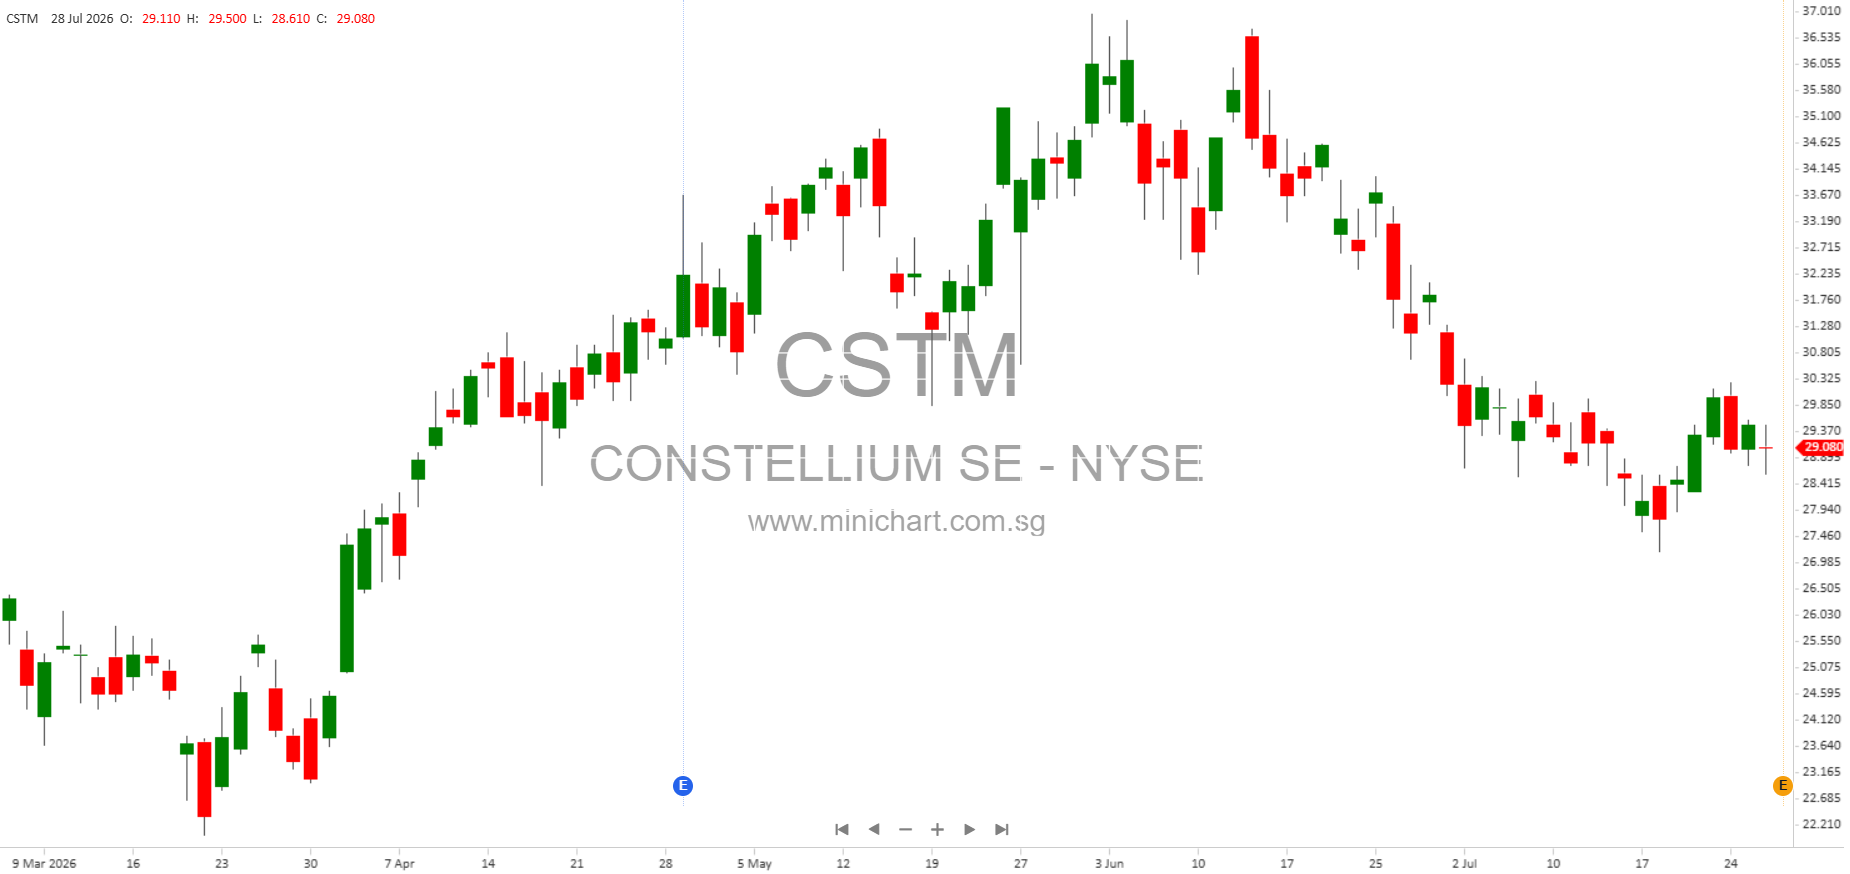
- Raised guidance for 2026 Adjusted EBITDA and Free Cash Flow, with targets now expected two years ahead of schedule. This is a significant positive signal for future earnings and may be price sensitive.
- Record results and a strong balance sheet despite macro and geopolitical uncertainty.
- Continued share buybacks and debt reduction reflect management’s confidence in the business, capital return focus, and strengthening financial flexibility.
- Leverage reduced to the lower end of the target range, enhancing financial safety and opening room for further capital allocation.
- Management’s positive tone and updated strategy execution may result in increased investor confidence and have positive implications for share value.
Disclaimer
This article is for informational purposes only and is not investment advice. All forward-looking statements are subject to risks and uncertainties, including but not limited to market conditions, geopolitical events, and company-specific factors. Actual results may differ materially. Please refer to company filings and consult with a professional advisor before making investment decisions.