Artisan Partners Asset Management Inc. Announces 2Q26 Financial Results and Quarterly Dividend
Date: July 28, 2026
Ticker: NYSE: APAM
Key Highlights
- Quarterly revenues of \$307.9 million for Q2 2026 (up from \$303.0 million in Q2 2025).
- Net income attributable to shareholders: \$80.9 million for Q2 2026 (compared to \$58.0 million in the prior year period).
- Basic and diluted earnings per share (GAAP): \$1.11 for Q2 2026 (up from \$0.76 in Q2 2025).
- Adjusted net income per adjusted share (Non-GAAP): \$0.94 for Q2 2026 (up from \$0.87 in Q2 2025).
- Operating margin: 27.5% (GAAP); Adjusted operating margin: 32.9% (Non-GAAP).
- Assets Under Management (AUM): Ended Q2 2026 at \$166.8 billion (down from \$179.9 billion at the end of Q2 2025).
- Declared a quarterly dividend.
CEO Commentary
Jason Gottlieb, Chief Executive Officer, commented:
“Our long-term strategy continues to deliver strong financial results. Despite facing persistent net outflows in select equity franchises, the earnings power of our diversified investment platform is clear. Adjusted operating income rose 13% to \$101.4 million, while adjusted operating margin expanded by 120 basis points to 32.9%. Adjusted earnings per share also increased by 13% to \$0.94. We remain focused on expanding our capabilities in areas with durable client demand such as credit and alternatives, and continue to invest in supporting our high-performing investment teams. Our strong balance sheet and consistent cash generation position us well for long-term growth and for continuing to return significant capital to shareholders.”
Detailed Financial and Operating Results
Assets Under Management
- Beginning AUM (Q2 2026): \$161.2 billion
- Gross client cash inflows (Q2 2026): \$9.2 billion
- Net client cash outflows (Q2 2026): \$(17.95) billion
- Investment returns and other (Q2 2026): \$15.2 billion
- Ending AUM (Q2 2026): \$166.8 billion
- Net outflows continue to be a headwind for certain equity franchises, but investment returns partially offset these outflows.
GAAP vs. Non-GAAP (Adjusted) Results
| Q2 2026 (GAAP) | Q2 2026 (Adjusted/Non-GAAP) | Q2 2025 (GAAP) | Q2 2025 (Adjusted/Non-GAAP) | |
|---|---|---|---|---|
| Revenues (\$M) | 307.9 | – | 303.0 | – |
| Operating Income (\$M) | 84.6 | 101.4 | 74.3 | 89.6 |
| Operating Margin (%) | 27.5% | 32.9% | 24.5% | 31.7% |
| Net Income Attributable to APAM (\$M) | 80.9 | 76.5 | 58.0 | 70.8 |
| EPS (Basic/Diluted) | 1.11 / 1.11 | 0.94 | 0.76 / 0.76 | 0.87 |
Balance Sheet Highlights
- Total assets (Q2 2026): \$1,459.5 million (down from \$1,577.3 million in Q2 2025)
- Total stockholders’ equity (Q2 2026): \$465.3 million (down from \$478.1 million in Q2 2025)
- Strong liquidity and capital position, supporting dividend payments and potential growth initiatives.
Dividend Announcement
The Board of Directors has declared a quarterly dividend, reflecting continued confidence in the company’s cash generation and long-term strategy. The exact amount and payment date were not specified in the summary but are available at www.apam.com.
Conference Call Details
- Date and Time: July 29, 2026, at 11:00 a.m. Eastern Time
- Webcast and supplemental materials: Available at www.apam.com
- Dial-in: 877.328.5507 (U.S.), 412.317.5423 (international), Conference ID: 10209594
- Replay available until August 5, 2026, at 9:00 a.m. Eastern Time
Shareholder and Market Impact
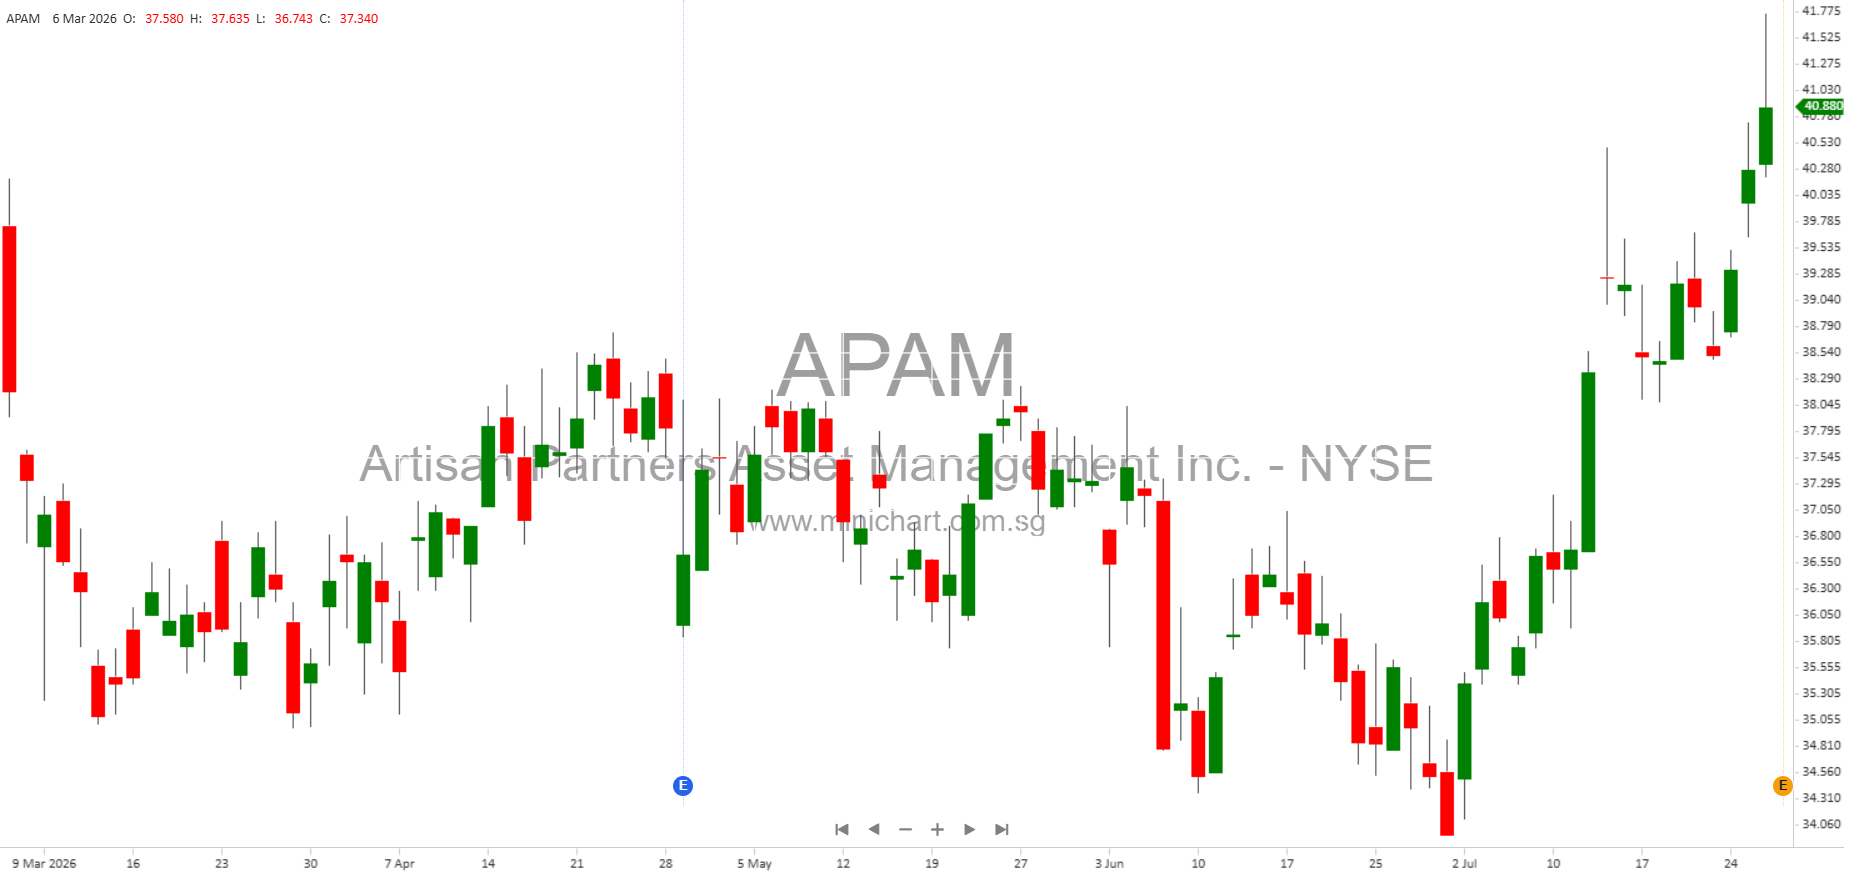
- Positive earnings surprise: Both GAAP and adjusted earnings per share showed double-digit growth year-over-year, which may positively influence investor sentiment and share value.
- Operating margin expansion: Indicates improved operational efficiency and profitability.
- Dividend continuity: Ongoing dividend payments, underpinned by strong cash generation, are likely to support the stock price and appeal to income-focused investors.
- Persistent net outflows: The company continues to experience net client outflows, particularly in select equity franchises. This remains a risk and could weigh on future asset growth and fee revenues if not reversed.
- Strategic focus on credit and alternatives: Management is emphasizing expansion into asset classes with durable demand, which, if successful, could diversify revenue streams and reduce dependence on underperforming equity franchises.
Risks and Forward-Looking Statements
- Management highlighted potential risks such as the loss of key investment professionals, adverse market conditions, regulatory changes, and poor investment performance, all of which could materially affect results.
- Forward-looking statements were made regarding the company’s strategy and future performance; actual results may differ due to various factors.
- Investors are directed to the company’s latest SEC filings for a comprehensive list of risk factors.
Disclaimer: This article is for informational purposes only and does not constitute investment advice. Investors should refer to the official SEC filings and consult with their financial advisors before making any investment decisions. Financial data and statements about future performance are subject to risks and uncertainties and may change without notice.