First Guaranty Bancshares, Inc. Reports Q2 2026 Results: A Detailed Investor Briefing
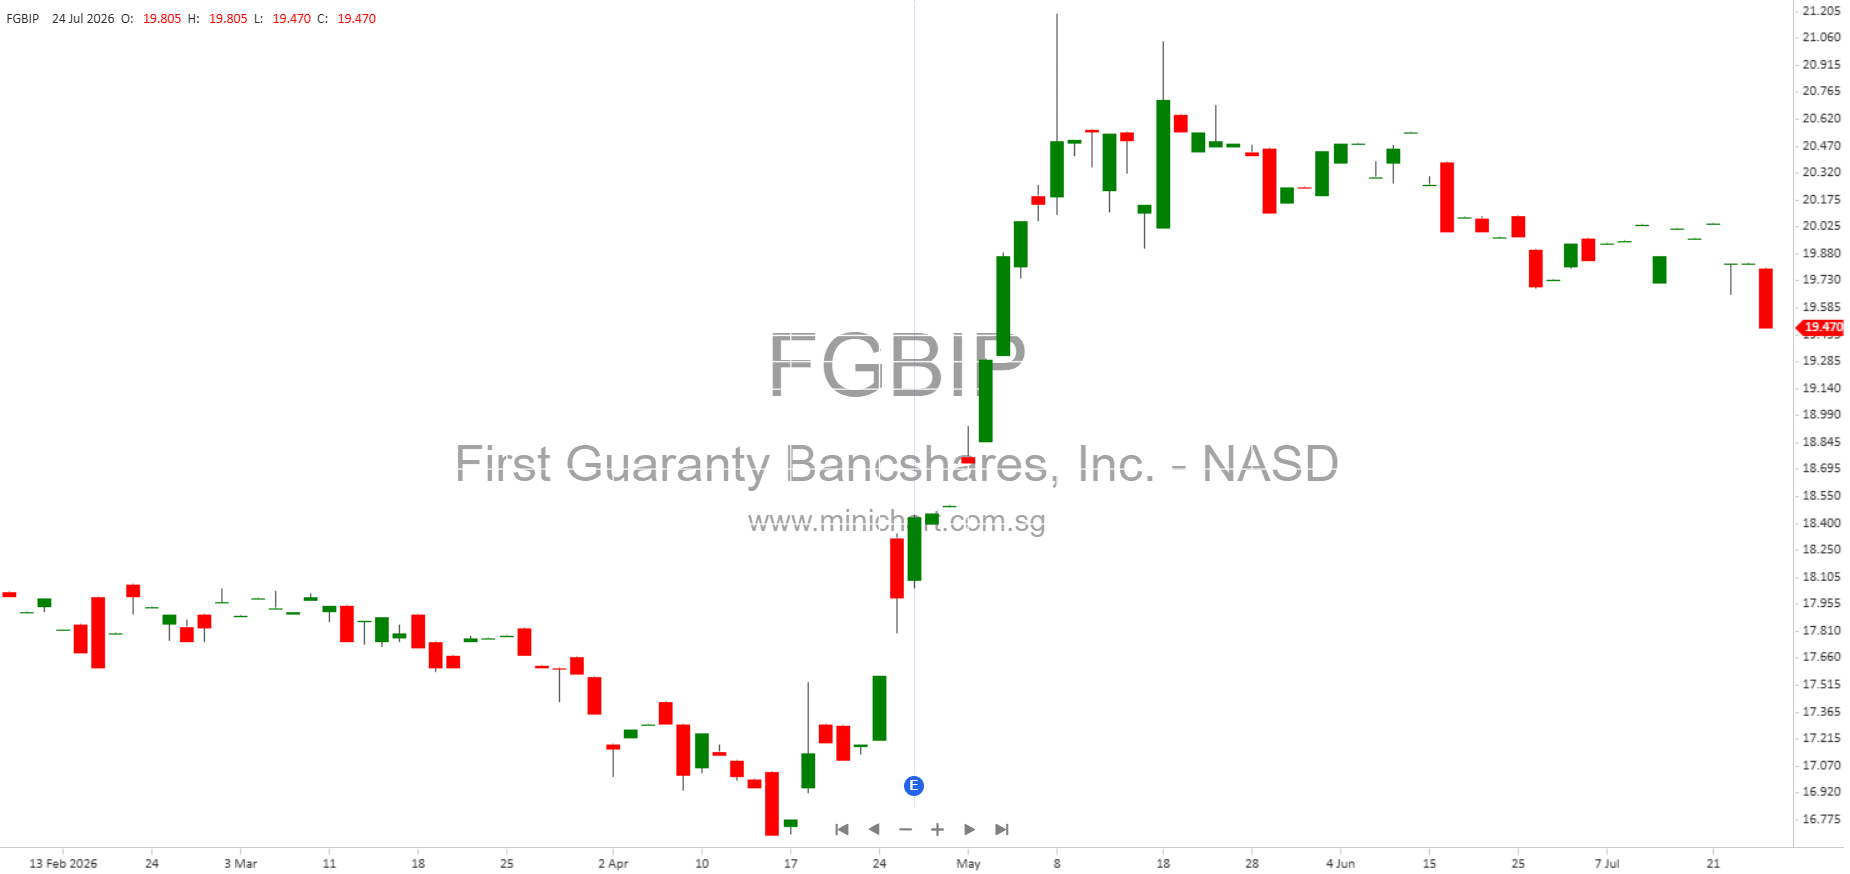
First Guaranty Bancshares, Inc. (“First Guaranty” or “the Company”), the holding company for First Guaranty Bank (NASDAQ: FGBI), has released its unaudited financial results for the second quarter and six months ended June 30, 2026. The results signal a significant turnaround in profitability, major balance sheet shifts, and ongoing strategic changes with potential implications for shareholders and the share price.
Key Financial Highlights
- Return to Profitability: Net income for Q2 2026 was \$3.4 million versus a loss of \$(7.3) million in Q2 2025. For the six months ended June 30, 2026, net income was \$6.2 million compared to a \$(13.5) million loss in the prior year period—an improvement of \$19.6 million.
- Earnings Per Share (EPS): Q2 2026 EPS was \$0.17 versus \$(0.61) the previous year. Six-month EPS was \$0.31 compared to \$(1.15) in 2025. Weighted average shares outstanding increased to over 16 million, reflecting new share issuance.
- Asset and Loan Contraction: Total assets decreased by \$183.3 million to \$3.9 billion since December 31, 2025. Loans declined sharply by \$304.6 million (14.7%) to \$1.8 billion. Deposits fell \$175.8 million (4.8%) to \$3.5 billion.
- Shareholders’ Equity: Stood at \$227.4 million at June 30, 2026, a modest rise from \$226.2 million at year-end 2025. Retained earnings increased by \$4.7 million within the same period.
- Allowance for Credit Losses: Slightly reduced to 1.94% of total loans (from 1.97%). The absolute allowance dropped from \$40.8 million to \$34.3 million, reflecting both charge-offs and lower loan balances.
- Net Interest Income & Margin: Q2 2026 net interest income was \$22.3 million (stable year-on-year). Net interest margin grew slightly to 2.37% in Q2 2026 (Q2 2025: 2.34%), but the six-month figure fell to 2.22% due to loan contraction.
- Provision for Credit Losses: Dramatically lower at \$2.6 million for Q2 2026 (Q2 2025: \$16.6 million), and \$5.3 million year-to-date (YTD) versus \$31.2 million in 2025.
- Charge-Offs & Recoveries: Q2 2026 charge-offs surged to \$7.7 million (Q2 2025: \$1.1 million), with six-month charge-offs at \$13.2 million (YTD 2025: \$8.0 million). Recoveries improved to \$1.5 million YTD (2025: \$0.4 million).
Balance Sheet and Asset Quality Trends
- Investment Securities: Increased by \$214.7 million to \$1.2 billion, mainly from higher available-for-sale securities.
- Nonaccrual Loans: Improved, down \$19.0 million to \$40.6 million since year-end 2025.
- Other Real Estate Owned (OREO): Reduced to \$29.7 million from \$35.1 million at year-end.
- Non-Performing Assets (NPAs): Declined from \$95.5 million at December 31, 2025 to \$70.3 million at June 30, 2026. NPAs as a percentage of total loans fell to 3.98% (from 4.61%) and as a percentage of total assets to 1.81% (from 2.34%).
- Special Mention & Substandard Loans: Special mention loans dropped to \$186.6 million (down \$142.9 million from December 2025), substandard loans fell to \$276.6 million (down \$71.0 million), and there were no loans classified as doubtful (down \$9.4 million).
Strategic & Price-Sensitive Developments
-
Texas Branch Sale:
- On March 10, 2026, the Bank signed an agreement to sell its Texas operations (five branches, related deposits, loans, and assets) to Armstrong Bank, Oklahoma.
- Transaction size: approximately \$227 million in deposits and \$93 million in loans.
- Expected Closing: July 31, 2026.
- This is a significant strategic retreat from the Texas market, likely impacting the Company’s future loan and deposit base, as well as branch footprint and cost structure.
-
Share Issuance and Book Value Impact:
- Book value per common share declined to \$11.75 (Dec 2025: \$12.23), primarily due to changes in accumulated other comprehensive income (AOCI), reflecting unrealized losses on securities, and the issuance of new shares.
- Tangible book value per common share was \$11.63 at June 30, 2026.
-
Dividend Consistency:
- Common dividend held at \$0.01 per share for Q2 2026 (unchanged from Q2 2025). This marks 132 consecutive quarterly dividends, reflecting continued commitment to shareholder returns despite recent volatility.
- Preferred stock dividends of \$1.2 million paid in first half of 2026 (unchanged year-on-year).
-
Cost Control and Workforce Reduction:
- Noninterest expense for Q2 2026 was \$17.2 million (Q2 2025: \$17.3 million), with a notable spike in Q3 2025 due to a \$12.9 million goodwill impairment.
- Full-time equivalent employees reduced to 333 (June 2025: 360), signaling cost-cutting and possible restructuring.
Asset Quality Details: Nonperforming & Charged-Off Loans
The top 10 nonperforming assets now comprise 78% of total non-performing assets, with significant exposures to commercial real estate, healthcare facilities, and land development—sectors that have shown stress nationwide. Notable loans include:
- \$23.3 million independent living center (Louisiana, now OREO)
- \$10.8 million assisted living center (Texas, nonaccrual)
- \$7.7 million commercial land development (Texas, nonaccrual)
- \$5.2 million multifamily apartments (Louisiana, nonaccrual with \$0.8 million specific reserve)
Charge-offs in Q2 2026 were dominated by commercial lease relationships (\$5.7 million and \$0.8 million, both fully written off), and a \$0.7 million non-farm non-residential loan (with \$0.4 million remaining). These figures indicate continued headwinds in the commercial and real estate lending book.
Regulatory Capital Position
- The bank remains well-capitalized by regulatory standards:
- Tier 1 leverage ratio: 7.09% (minimum: 5.00%)
- Tier 1 risk-based capital ratio: 14.95% (minimum: 8.00%)
- Total risk-based capital ratio: 16.21% (minimum: 10.00%)
- Common equity tier one capital ratio: 12.24% (minimum: 6.5%)
- The capital conservation buffer is well above the regulatory minimum, supporting the company’s resilience and flexibility.
Other Noteworthy Items
- Noninterest Income: Slightly down YTD at \$4.1 million (2025: \$4.5 million), with stable service charges, card fees, and other recurring items.
- Noninterest Expense Details: Major categories include regulatory assessment (\$1.8 million in Q2), legal and professional fees, data processing, and costs from OREO and repossessions.
- Community Bank Leverage Ratio: New rule lowering the qualifying threshold to 8% took effect July 1, 2026, but the bank has not yet adopted this framework.
- Forward-Looking Statements: Management reaffirms forward-looking caution, noting ongoing risks tied to asset quality, market conditions, and regulatory changes.
Potential Share Price Impacts & Investor Takeaways
- Positive Catalysts:
- Return to profitability and improved asset quality ratios may bolster investor confidence and the share price.
- Reduced credit loss provisions and lower NPAs signal stabilizing credit risk after a challenging 2025.
- Continued dividend payments and regulatory capital strength are supportive for income-focused investors.
- Risks and Caution Flags:
- Significant loan and deposit contraction, plus the Texas branch divestiture, will shrink the Company’s balance sheet and may compress future earnings power.
- Ongoing high charge-offs, especially in commercial and real estate lending, could weigh on future results if asset quality does not improve further.
- Book value dilution from share issuance and AOCI losses may concern value investors.
- The concentration of non-performing assets in a small number of large relationships remains a material risk.
Conclusion
First Guaranty Bancshares, Inc. has engineered a notable turnaround to profitability in the first half of 2026, but the results are mixed. The Company is shrinking its balance sheet and exiting the Texas market, which will reshape its future earnings base. Asset quality is improving, but remains challenged by high charge-offs and concentration risks. Investors should closely watch the execution of the Texas divestiture, future loan book health, and management’s ability to maintain profitability and dividends amidst a smaller, more focused franchise.
Disclaimer: This article is for informational purposes only and does not constitute investment advice or a recommendation to buy or sell any securities. All financial figures are based on unaudited reports and may be subject to change. Investors should consult official SEC filings and their own advisors before making any investment decisions. The author and publisher accept no liability for actions taken based on this report.