First Commonwealth Financial Corporation Posts Strong Q2 2026 Results, Announces Dividend Increase and Major Share Repurchase Authorization
Key Highlights for Investors
- Q2 2026 GAAP Net Income: \$44.6 million, or \$0.44 per diluted share, up 18.7% from Q1 2026 and 33.4% from Q2 2025.
- Core Net Income: \$44.4 million, or \$0.44 per share, up from \$37.5 million in Q1 2026 and \$39.5 million in Q2 2025.
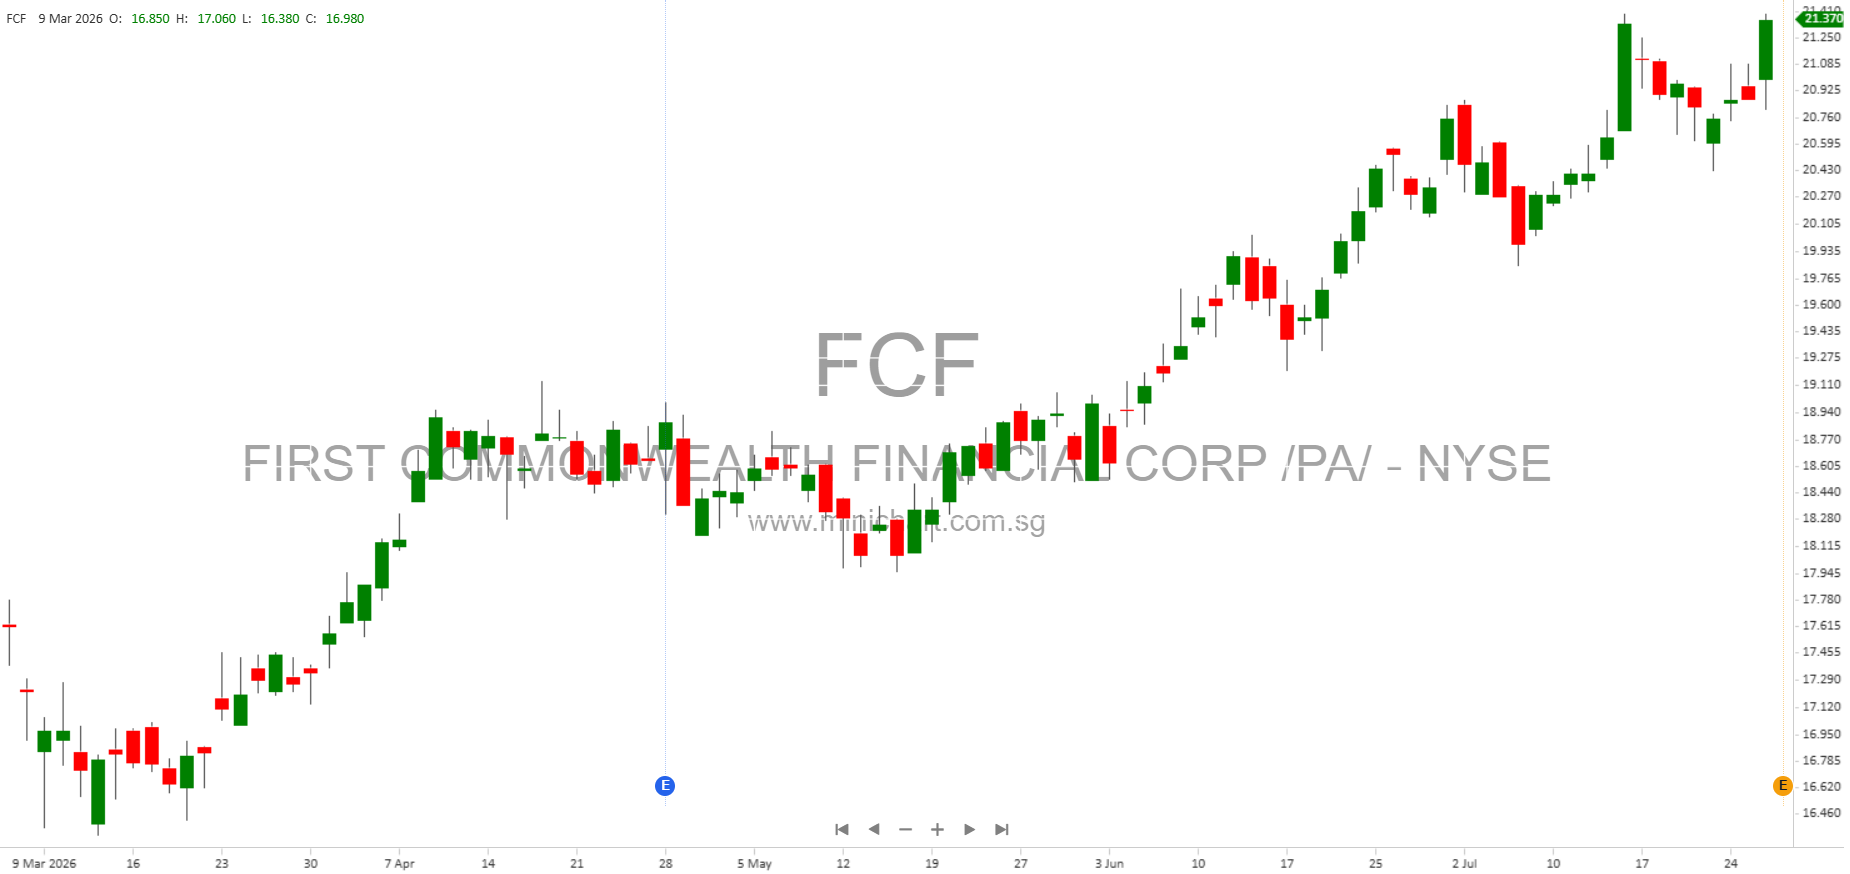
- Quarterly Dividend Raised: Increased to \$0.14 per share, 3.7% higher than Q2 2025. Implies a projected annual yield of 2.7% at the July 27, 2026 closing price (\$20.87).
- New \$75 Million Share Repurchase Authorization: Announced on July 28, 2026, in addition to \$13 million remaining under the prior program.
- Net Interest Margin (NIM): Rose to 4.01%, up 9 bps sequentially and 18 bps year-over-year, supporting earnings growth.
- Core Efficiency Ratio: Improved to 52.24% from 55.43% in Q1 2026, reflecting better operating leverage.
- Asset Quality: Nonperforming loans fell to \$81.6 million (0.86% of loans). Allowance for credit losses at 1.35% of loans. Net charge-offs increased to \$11.4 million, primarily due to the resolution of six commercial credits.
- Capital Strength: Bank-level Total Capital Ratio at 14.0% (\$393.8 million above “well capitalized” threshold). Tangible book value per share grew 8.5% annualized from Q1.
- Recognition: First Commonwealth Bank named to TIME Magazine’s 2026 America’s Best Companies list.
Detailed Financial Performance
Earnings Surge on Margin Expansion and Operating Leverage
First Commonwealth Financial Corporation (NYSE: FCF) delivered robust second quarter results, with net income of \$44.6 million (\$0.44 per diluted share), outperforming the prior quarter by \$7.0 million and the prior year quarter by \$11.2 million. Core net income also grew, reflecting the company’s focus on underlying business performance.
The company’s net interest margin (NIM) expanded to 4.01%, a sequential increase of 9 basis points, driven by a favorable deposit mix, lower cost of funds (down 7 bps to 1.79%), and higher yields on loans and securities. Net interest income (FTE) rose by \$3.5 million from Q1, offsetting a slight decrease in average interest-earning assets.
Noninterest income (excluding securities gains) reached \$26.7 million, up \$2.3 million quarter-over-quarter. This was fueled by a \$0.8 million gain on early redemption of subordinated debt, higher income from bank owned life insurance, and limited partnership gains. Card-related interchange fees and other revenues also increased.
Noninterest expense (excluding merger-related costs) declined by \$1.3 million to \$74.1 million, due to lower furniture and equipment costs (including a vendor rebate), reduced occupancy (notably snow removal), and lower FDIC insurance assessments.
The core efficiency ratio improved notably to 52.24%, signifying enhanced operating leverage and cost management.
Loan and Deposit Trends
- Total loans grew \$46.5 million (2.0% annualized) quarter-over-quarter.
- Average deposits increased \$52.3 million (2.0% annualized), with gains in both interest-bearing and noninterest-bearing categories. However, end-of-period deposits fell by \$149.8 million (5.8% annualized), reflecting customer mix shifts and typical seasonal outflows.
- Loan-to-deposit ratio ticked up to 92.7% from 90.9%.
- Tangible book value per share climbed \$0.24 to \$11.58.
Asset Quality and Capital Resilience
- Provision for credit losses was \$8.9 million (down \$1.8 million from Q1).
- Nonperforming loans decreased by \$10.7 million to \$81.6 million (0.86% of loans), driven by the resolution of six commercial credits (\$6.9 million in aggregate).
- Net charge-offs rose to \$11.4 million (0.49% of average loans, annualized), versus \$8.2 million (0.35%) in Q1 and \$2.8 million (0.12%) in Q2 2025, mainly due to the aforementioned commercial credit resolutions.
- Allowance for credit losses stood at 1.35% of period-end loans.
- Strong capital metrics: Total Capital Ratio (bank-level) at 14.0%; consolidated ratios well above regulatory requirements — Total 15.1%, Tier I 13.4%, Leverage 11.1%, Common Equity Tier I 12.6%.
Shareholder Actions and Capital Return
- During Q2, the company repurchased 645,695 shares at an average price of \$18.66, with \$13 million left under the existing buyback program as of quarter-end.
- On July 28, 2026, a new \$75 million share repurchase program was approved, reflecting confidence in future prospects and ongoing commitment to shareholder returns.
- The quarterly dividend was raised to \$0.14 per share, payable August 21, 2026, to shareholders of record as of August 7, 2026.
Strategic Commentary
President and CEO T. Michael Price emphasized, “The momentum we generated during the second quarter reinforces confidence in First Commonwealth’s long-term outlook. We successfully balanced profitable loan growth with disciplined funding costs, supporting continued margin expansion and meaningful earnings growth. While the economic environment remains dynamic, we believe our strong capital position, diversified revenue streams, focus on operating leverage, and regionally led business model position us to continue creating value for our stakeholders.”
Price-Sensitive and Shareholder-Relevant Items
- New \$75 Million Share Repurchase Authorization: This sizable new buyback program could support the share price and signals management’s confidence in the company’s earnings and capital position.
- Dividend Increase: The 3.7% year-on-year raise in the quarterly dividend demonstrates strong capital management and shareholder focus.
- Margin and Earnings Growth: Improved NIM and efficiency ratio, along with robust earnings, could attract further investor attention and potentially support a higher valuation.
- Recognition by TIME Magazine: Being named to “America’s Best Companies” list may enhance corporate reputation and appeal to ESG-focused investors.
- Capital Strength: Ratios well above regulatory minimums provide flexibility for continued shareholder returns and strategic initiatives.
Risks and Forward-Looking Statements
Management highlighted several potential risks in their forward-looking statements, including financial market volatility, regulatory changes, competitive pressures, changes in interest rates, and the general economic environment.
Conference Call Details
First Commonwealth will host a conference call to discuss Q2 2026 results on July 29, 2026 at 2:00 PM (ET). Details are available on the company’s investor relations webpage.
Disclaimer: This article is for informational purposes only and does not constitute investment advice. Investors should review official SEC filings and consult with their financial advisors before making any investment decisions. Forward-looking statements are subject to risks and uncertainties that could cause actual results to differ materially.