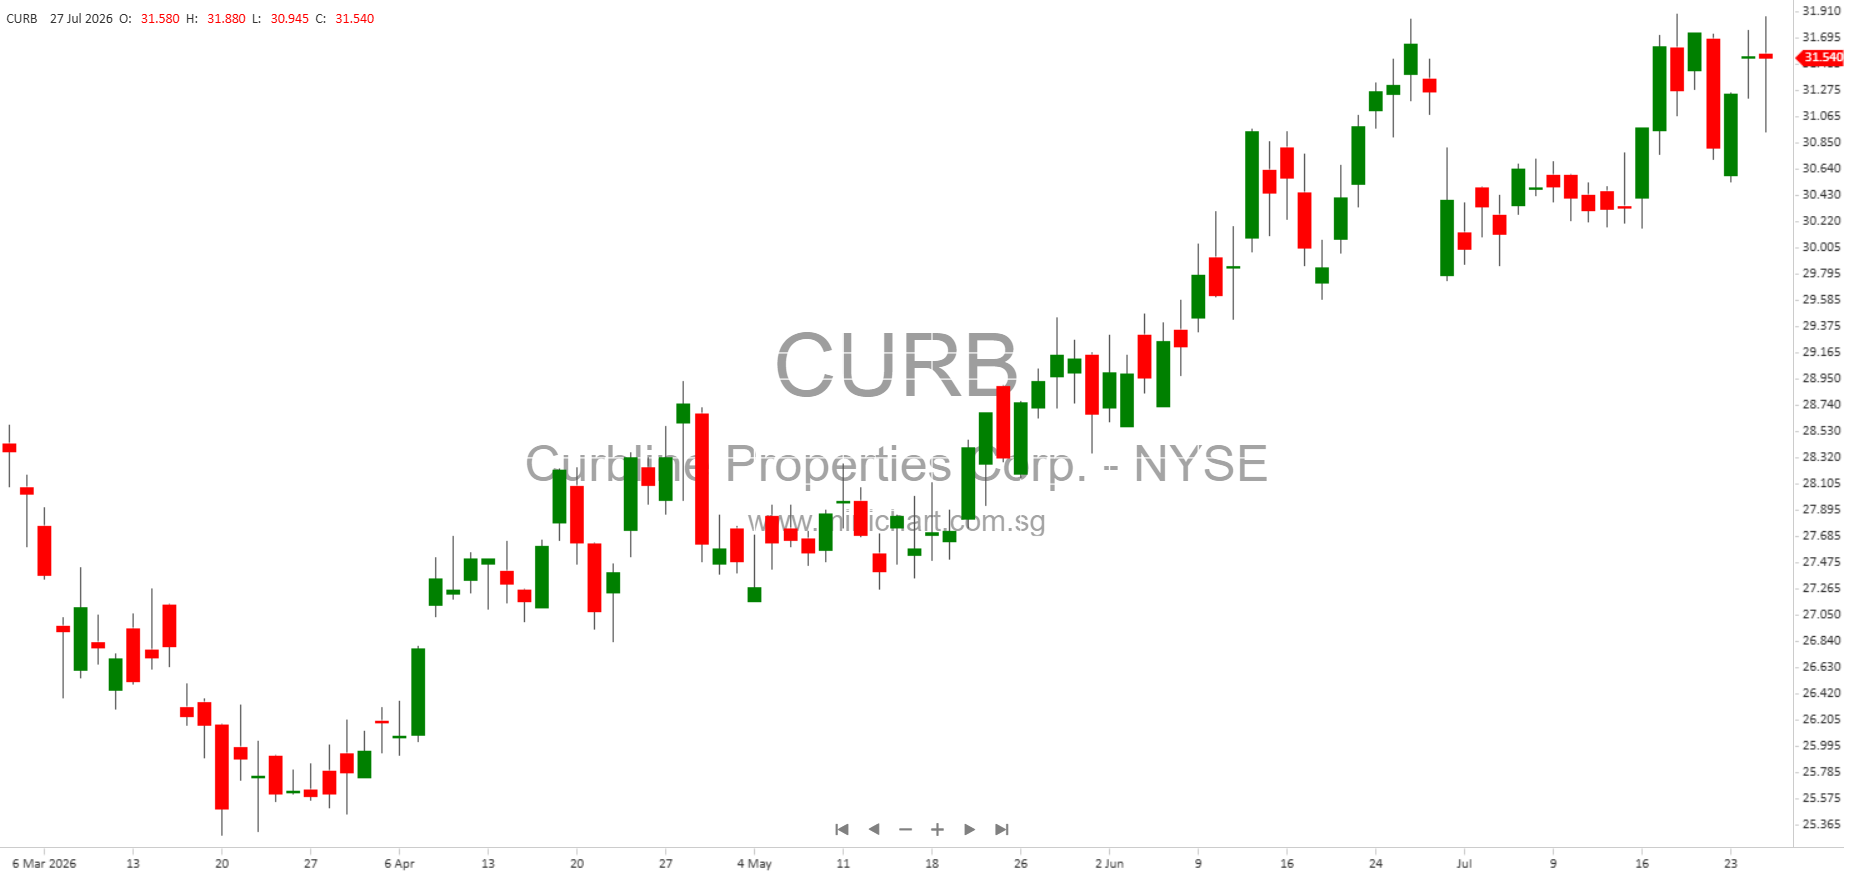
Curbline Properties Delivers Strong Acquisition-Driven Growth in 2Q26; Updates 2026 Guidance
Key Highlights from the Second Quarter 2026 Report
- Market Capitalization: \$3.5 billion as of June 30, 2026
- Portfolio Expansion: 220 properties concentrated in high-income suburban corridors
- Leased Rate: 96.5%, up from 96.1% a year ago
- YTD Acquisitions: 48 convenience shopping centers for \$563.7 million
- Active Capital Raising: \$823.5 million gross proceeds from equity offerings in 2026 YTD
- Robust Liquidity: \$850.9 million in cash and capital commitments for future acquisitions
- FFO Guidance Raised: 2026 Operating FFO now projected at \$1.24 to \$1.26 per diluted share
- First Corporate Sustainability Report Published
Detailed Financial and Operational Performance
Quarterly Financial Results
- Net Income: \$6.9 million for 2Q26 (\$0.06/diluted share), down from \$10.4 million in 2Q25 (\$0.10/diluted share). The year-over-year decrease is attributed to higher interest expense and increased share count, despite strong net operating income from acquisitions.
- Rental Income: Jumped to \$63.1 million in 2Q26 from \$41.1 million in 2Q25, reflecting significant portfolio growth.
- Net Operating Income (NOI): \$47.8 million for 2Q26, up from \$30.8 million in 2Q25.
- Operating FFO: \$33.3 million for 2Q26, up from \$26.9 million in 2Q25.
- Operating FFO per Share (Diluted): \$0.31 for 2Q26, compared to \$0.26 for 2Q25.
Guidance Updates for 2026
- Net Income Attributable to Curbline: Updated to a range of \$0.27 to \$0.32 per diluted share (down from prior guidance of \$0.29 to \$0.36).
- Operating FFO per Diluted Share: Raised to \$1.24 to \$1.26 (previously \$1.20 to \$1.23), reflecting expectation for improved property-level performance and accretive acquisitions.
Acquisition and Capital Market Activity
- Acquisitions: 30 convenience shopping centers acquired in 2Q26 for \$374.1 million; 4 additional centers acquired in 3Q26 to date for \$47.1 million.
- Dispositions: No major property sales reported for the quarter.
-
Equity Capital Raising:
- 6.6 million shares sold via ATM program for \$186.5 million gross (2Q26)
- 11.5 million shares sold via follow-on public offering in June for \$354.8 million gross
- 8.4 million shares settled from prior forward sales for \$199.8 million net proceeds
- Year to date, 29.3 million shares sold on a forward basis for \$823.5 million expected gross proceeds
- Cash and Capital Commitments: \$850.9 million available for future acquisitions (as of June 30, 2026), including \$154.7 million cash on hand and \$696.2 million from unsettled forward equity sales.
Leasing and Portfolio Metrics
- Leased Rate: 96.5% as of June 30, 2026 (up from 96.1% a year ago and 97% at year-end 2025).
- Same-Property NOI Growth: 2.1% increase for the six-month period ended June 30, 2026.
-
Leasing Spreads:
- TTM Cash New Leasing Spread: 20.2%
- TTM Cash Renewal Spread: 7.4%
- 2Q26 Cash New Leasing Spread: 8.2%
- 2Q26 Cash Renewal Spread: 8.6%
- TTM Straight-Lined New Leasing Spread: 35.7%
- TTM Straight-Lined Renewal Leasing Spread: 17.1%
- Signed Not Opened Spread: 220 basis points, representing \$7.6 million of annualized base rent as of June 30, 2026.
Balance Sheet and Capital Structure
- Total Assets: \$2.84 billion as of June 30, 2026 (up from \$2.47 billion at December 31, 2025).
- Total Debt: \$600 million (all unsecured; no secured debt outstanding).
- Net Debt: \$445 million.
- Equity Market Capitalization: \$3.47 billion.
- Enterprise Value: \$3.91 billion.
- Credit Rating: BBB (Stable) from Fitch.
- Debt Covenants: Substantial cushion with Unsecured Debt/Total Market Value at 19% (covenant: 60%), Unencumbered Assets Coverage at 5.3x (covenant: 1.7x), and Fixed Charge Coverage at 5.8x (covenant: 1.5x).
Sustainability and Corporate Developments
- First Corporate Sustainability Report: Released in June 2026, aligned with Task Force on Climate-Related Financial Disclosure (TCFD) standards, marking Curbline’s first full year of sustainability reporting as a public company.
Key Issues for Shareholders
- Accelerated Portfolio Growth: The company’s acquisition-driven growth strategy has rapidly increased scale, which could drive continued earnings accretion but may also present integration and capital allocation risks.
- Active Equity Issuance: Curbline has issued significant equity in 2026 YTD, which increases share count but provides substantial liquidity for accretive investments. Existing shareholders should monitor dilution and the company’s ability to deploy proceeds profitably.
- Rising Interest Expense: Higher interest costs impacted net income, though the company maintains strong debt coverage metrics and investment-grade credit ratings.
- Leasing Momentum: Robust new and renewal leasing spreads indicate strong market demand and pricing power, which should support future NOI growth and property values.
- Updated Guidance: The increase in Operating FFO guidance for 2026 is a positive indicator of management’s confidence in cash flow generation, which may be supportive for the share price.
- Sustainability Reporting: The inaugural Corporate Sustainability Report may attract additional ESG-focused investors and provides transparency on environmental risks and initiatives.
Potential Market Impact
Price-Sensitive Developments: The upward revision to Operating FFO guidance, significant acquisition activity, sizable equity capital raises, and strong leasing spreads are all material developments that may positively influence the share price. However, the reduction in net income guidance and the ongoing dilution from equity issuance could be viewed as offsetting factors by some investors.
Investor Outlook: Curbline’s continued focus on acquiring high-quality convenience shopping centers in affluent suburbs, coupled with prudent balance sheet management and robust leasing results, position the company for sustainable FFO growth. Investors should monitor management’s execution on acquisitions and integration, as well as any shifts in retail tenant health or capital market conditions.
Disclaimer: This article is for informational purposes only and does not constitute investment advice or a recommendation to buy or sell any securities. Investors should conduct their own research and consult with their financial advisors before making investment decisions. The information is based on the latest quarterly financial supplement released by Curbline Properties as of June 30, 2026, and is subject to change without notice.